The average tenant who got the keys to a rent-controlled flat in Stockholm last year had waited nine years for it1. For a flat in the inner city the wait was twenty-one years2. Nobody set out to build that. Sweden set out to build a system in which rents were negotiated collectively and held below what the market would charge: a reasonable aim, and one it achieved. The queue is the price of that success, and it is paid in years by people who are not yet in the room when the policy is decided.
The same pattern runs through most of the evidence. Rent caps do what they promise, in study after study. But the promise is narrower than the slogan, and the cost lands where the slogan never looks.
The cleanest experiment anybody has run
Berlin ran it. On 23 February 2020 the Mietendeckel came into force. It froze the rent on roughly 1.5 million flats (every unsubsidised rental home in the city finished before 2014) at whatever had been validly agreed on 18 June 20193. The statute is blunt: “ist eine Miete verboten, die die am 18. Juni 2019 (Stichtag) wirksam vereinbarte Miete überschreitet” (a rent above the one agreed on the cut-off date is forbidden). Nine months later a second stage forced sitting rents down to no more than twenty per cent above a statutory table. The table ran from €3.92 to €9.80 per square metre, depending on the building’s age and fittings, and averaged about €6.28. It was built by taking Berlin’s 2013 rent index and uprating it for seven years of real wage growth4. Landlords who charged more could be fined up to half a million euros.
This was a hard cap, the version economists write their textbook chapters about. For once it was applied to a large European capital, with a clean control group inside the same city: flats completed from 2014 onwards were exempt. The results came quickly, and they are unambiguous.
One bar went down. Three went up.
Change in advertised rent under the Berlin Mietendeckel. Capped flats are measured against exempt Berlin flats, formerly capped ones against the thirteen other German cities with more than 500,000 people; the other two bars are plain changes in average asking rent.
Show the numbers
| Segment | Period | Change in advertised rent |
|---|---|---|
| Flats covered by the cap | first four weeks | −7% to −11% |
| Berlin flats exempt from it | first year of the cap | +9% |
| Potsdam, just outside Berlin | first months of the cap | +12% |
| Formerly capped, after the cap | from 2023, v. counterfactual | +10% to +15% |
In the four weeks after the cap took effect, advertised rents on the covered flats fell by “sieben bis elf Prozent” (seven to eleven per cent) against the exempt ones, and the DIW team behind the study conclude that the cap caused the fall5. The policy did its job. In the same four weeks a median of 263 flats a week were advertised for rent in Berlin, against 619 a week between the cap’s announcement and its entry into force. The authors’ conclusion takes the top of their range: prices for new lettings fell by more than ten per cent, but “verknappt sich das Angebot an zu vermietenden Wohnungen um mehr als die Hälfte” (the supply of flats to rent shrank by more than half). Meanwhile average asking rents on the exempt flats, which the cap could not touch, rose by about €1.40 per square metre, “einem Zuwachs von 9% im Zeitraum eines Jahres”, a rise of nine per cent in a year6. In Potsdam, just outside Berlin’s jurisdiction, rents rose about twelve per cent5.
Most adverts ignored the ceiling. In the DIW data only about a quarter of advertisements quoted a lawful rent5; in the last quarter ifo observed, “ca. 80% der Wohnungsannoncen” named a rent above it. Many of them probably gave the rent in the contract rather than the rent actually charged, because landlords wrote two rents into the contract: the capped one, paid while the law stood, and a “Schattenmiete”, a shadow rent that would fall due if the law were struck down67.
The court that never ruled on the economics
It was struck down. On 25 March 2021 the Second Senate of the Federal Constitutional Court held the entire statute void, on grounds that had nothing to do with whether it worked. Rent levels for privately financed housing, the court held, are part of civil law, and the federal legislature had already occupied that field: “Mit den §§ 556 bis 561 BGB hat der Bundesgesetzgeber von der konkurrierenden Zuständigkeit für das Mietpreisrecht als Teil des bürgerlichen Rechts abschließend Gebrauch gemacht”8. Berlin had legislated on something that was not Berlin’s to legislate on. The operative part of the ruling declares the law “unvereinbar und nichtig” (incompatible and void) under the Basic Law’s rules on competence, and says no more.
So the shadow rents took effect. Tenants who had been paying the capped amount now owed the difference in one sum. The Senate reckoned that about 40,000 Berliners might need help to pay it, and offered interest-free loans7. The experiment ended without anyone in authority ever ruling on whether it had been a good idea.
The economists kept measuring, though, and the most uncomfortable finding came later. Three years after the cap was gone, ifo found Berlin’s price-to-rent ratio still “10 bis 15 % unter dem Trend” (ten to fifteen per cent below trend), while asking rents in the formerly capped segment had settled “stabil 10 bis 15 % über dem kontrafaktischen Niveau”, ten to fifteen per cent above the counterfactual, which ifo builds from the thirteen other German cities with more than 500,000 people9. The flats the cap had covered ended up dearer, not cheaper. The authors blame the regulatory risk that outlived the cap, kept alive by the 2021 referendum on expropriating large landlords: investors price in the chance that Berlin will intervene again.
The short-run damage, by contrast, did not last. The thinner market, the harder search and the frozen mobility “hatten sich dagegen bis 2023 wieder weitestgehend aufgelöst”, had largely resolved themselves by 2023, so they cannot explain the lasting discount9. The listings came back; the valuation did not.
Berlin had legislated on something that was not Berlin’s to legislate on.
The case for the cap
Now take the strongest case for capping rents. It is stronger than its opponents usually admit.
Start with Catalonia, which capped rents in 61 municipalities in September 2020 and saw the law annulled eighteen months later. The economists who studied it found rents down four to six per cent and no evidence of a fall in supply on any of their three measures: new tenancy agreements signed, agreements ended, and the active stock of rental units. They conclude that “rent control policies can effectively reduce rental prices without necessarily shrinking the rental market”10. They even found rents falling 2.7 per cent in the unregulated municipalities next door, the opposite of Berlin’s spillover.
Second, caps do what tenants’ organisations say they do: they stop people being pushed out. The San Francisco study that everybody cites against rent control reports that the policy “increased renters’ probabilities of staying at their addresses by nearly 20%”11. The effect was concentrated where a city might want it: white tenants were 2.8 percentage points more likely to still be in San Francisco, while Black, Hispanic and Asian tenants were 10.7, 10.1 and 6.4 points “more likely to remain in San Francisco”12. For a great many voters, that is the entire point.
Third, the milder German instrument looks nothing like Berlin’s. The Mietpreisbremse of 2015 caps a new lease at ten per cent above the local reference rent. It exempts flats first used and let after 1 October 2014, in effect new buildings, and the first letting after a comprehensive modernisation13. The federal justice ministry’s own evaluation found that it worked as intended, cutting rents in the controlled stock by about two to three per cent when it took effect. It concluded that the available evidence “spricht eher für eine Neubau anregende Wirkung der Regulierung”: if anything, the rule stimulated construction, because the exemption made new building the profitable thing to do14. The peer-reviewed follow-up is less cheerful. It finds that the brake pushed up rents in the exempt part of the market, and that better-off tenants in controlled areas moved less, a sign that flats and households end up mismatched15. But nobody has found Berlin-scale wreckage.
Fourth, the cheapest objection turns out to be wrong. The usual jibe is that landlords simply dodge the brake by letting flats furnished. The justice ministry commissioned a study to find out, and it did not find what the jibe predicts: “es keine Indizien für eine umfassende strategische Umwandlung gibt” (no sign of wholesale strategic conversion). Landlords of furnished flats do seem to have raised their furniture surcharges, but significantly only for flats probably let for temporary use, which the brake does not cover; for flats probably bound by it, surcharges tended to fall16.
Fifth, the literature itself is more divided than the profession’s public voice. Konstantin Kholodilin, who has reviewed almost all of it, is blunt about housing quality: “All studies, except for Lind (2015), indicate that rent control leads to a deterioration”17. On new building, the charge critics lean on most, he is more careful: “The impact of rent control on new residential construction is the most ambiguous effect of all”. More than half of the studies find a negative effect, but several find none. Richard Arnott made the general case thirty years ago. He conceded that first-generation controls were harmful, then argued that the modern ones are a different animal: “the case against second-generation rent controls is so weak that economists should at least soften their opposition to them”18. He also argued that the profession’s confidence here had an ideological component.
Who pays
So the cap works. The question is who it works for, and here the numbers are clear.
Diamond, McQuade and Qian put a figure on both the gains and the losses in San Francisco. Protected tenants gained between $2,300 and $6,600 a person a year, about $2.9 billion in all in present value. The city’s renters as a whole lost about $2.9 billion, through a 5.1 per cent rise in rents caused by a six per cent fall in the city’s rental supply (fifteen per cent in the buildings the law covered). The two figures are the same size, which the authors note with some surprise. Forty-two per cent of the loss fell on people who did not yet live in San Francisco when the law changed11. In the authors’ own summary, incumbents came out ahead, but “this is at the great expense of welfare losses from future inhabitants”11.
Every housing policy is a rule about who counts as an insider.
The Cambridge decontrol study points the same way from the other end. When Massachusetts abolished rent control in 1995, property values in Cambridge rose, and most of the gain went to buildings that had never been controlled but stood near ones that had: “the majority of this contribution stems from induced appreciation of never-controlled properties”19. Control had been depressing the value of the neighbourhood, not just of the regulated flats. In the working-paper version the authors are scrupulous enough to add that a majority of Cambridge residents had voted to keep the policy, so “the median Cambridge voter perceived the benefits of rent control to exceed the costs”20.
Every housing policy is a rule about who counts as an insider. A rent cap draws that line at the front door of people who already have a tenancy. It is generous to them, and whoever comes next pays for it: the couple moving for a job, the twenty-three-year-old, the refugee, the person leaving a marriage. None of them vote in the election that sets the policy, because none of them live there yet.
The steady state
Berlin’s cap lasted thirteen months. To see what a cap looks like after eighty years, go back to Stockholm.
What a rent cap looks like after eighty years
Average time in the Stockholm housing queue for flats actually allocated in 2025.
Show the numbers
| Kind of flat | Average years in the queue, 2025 |
|---|---|
| Inner Stockholm | 21 |
| Short-term contracts | 12.5 |
| Stockholm city | 12.4 |
| Senior flats | about 10 |
| Every ordinary flat | 9.0 |
| Newly built flats | 5.8 |
| Student flats | 4.5 |
The nine-year average covers every ordinary rental flat let through the queue, inside and outside the county. It hides a queue that is really a hierarchy: twelve and a half years for a short-term contract, a little over twelve for the city of Stockholm proper, twenty-one for the inner city. Student flats go in four and a half years. Newly built flats go in under six. Some of that is the supply argument at work inside the rationing system, and some of it is that many new blocks are in less central places.
There are two qualifications. The queue register is not a waiting list of desperate people: 894,592 were registered at the end of 2025, and only 88,918 of them, one in ten, made at least five applications during the year1. And nine years is an average, not a sentence. The agency itself says that most people on the register are not actively looking, and that getting a flat can take anything from a couple of weeks to twenty years or more2.
But the sublet market shows what the queue is worth. By law, a controlled flat may not be sublet for more than the first-hand rent, plus at most 15 per cent if it comes furnished. It happens anyway. The government’s 2025 inquiry into the rental market reports that advertised second-hand rents in Greater Stockholm were 72 per cent above first-hand rents in 2016. Boverket, the national housing agency, put the whole second-hand market, owner-occupied homes included, at more than 200,000 lettings a year in 2018, while warning that “det finns en stor osäkerhet rörande andrahandsmarknadens omfattning”: its size is very uncertain21. If you cannot get a controlled flat for nine years but can sublet one at once at a 72 per cent premium, the controlled rent works less like a price for housing than like a lottery ticket with a resale value.
Vienna, the good answer
The serious rebuttal to all of this is Vienna, and it deserves to be taken at its strongest.
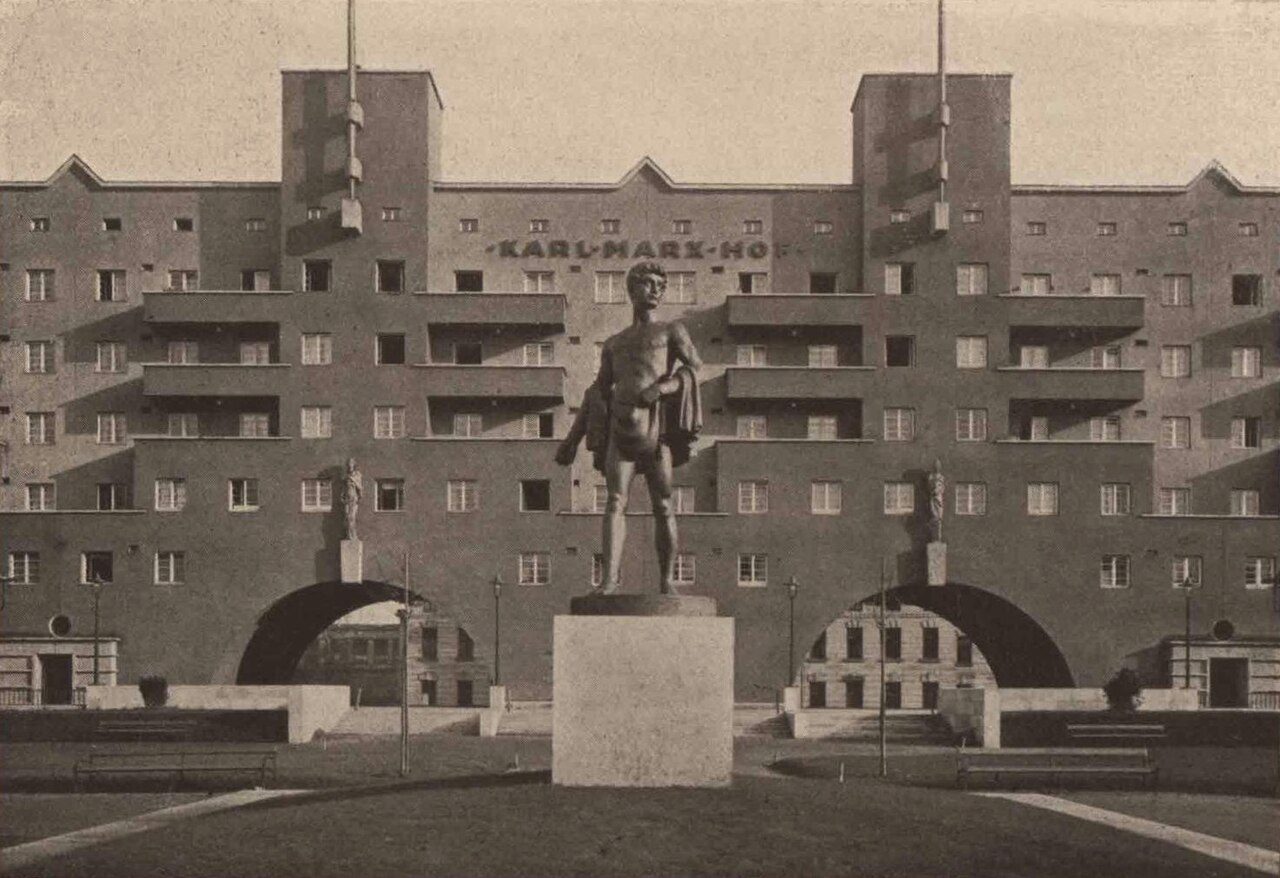
Twenty per cent of Viennese households live in a council flat and another twenty-two per cent in a limited-profit cooperative: forty-two per cent of the city, in housing that is not trying to maximise a return22. It shows in what tenants pay. In a 2021 comparison of New York, Berlin and Vienna, the share of tenants paying more than thirty per cent of income in rent was 48 per cent in New York, 40 in Berlin and 32 in Vienna23. Vienna got there by housing a fifth of its households itself and building for a century, rather than by capping private rents harder than Germany does.
The catch is that Vienna is an insider system too, and its own researchers say so. To join the list you need two years of continuous residence in the city. Allocation then runs on points, and up to 45 of them are awarded for length of residence alone; twenty years or more earns the maximum. Other criteria can count for more, such as being under 25 without a tenancy of your own, but the residence bonus is one that no newcomer can earn24. The income test applies when you move in and never again, so a household that prospers keeps the flat2526. Tenancies are long: across Austria the average council tenancy has already lasted 16.7 years, against seven in a private let, and most of Austria’s council flats are in Vienna22. Kadi and his co-authors conclude that “access for newcomers to the city has become more difficult”, and that giving priority to long-standing residents discriminates in particular against immigrants23. Vienna also stopped building council housing in 2004 and started again only in 2015; the authors call the plan for 4,000 new council flats by 2025 “a drop in the ocean” for a city expected to grow by more than 150,000 people by 203023.
This is no reason to dismiss Vienna, whose outcome beats Berlin’s and New York’s by a wide margin. But the system was not built to take in newcomers. It is a very large, very well-run version of the same bargain: excellent terms for those inside, a long wait for those outside.
What economists think
Economists are famously near-unanimous here: in a 1990 survey of American economists, 93.5 per cent agreed, fully or with provisos, that “A ceiling on rents reduces the quantity and quality of housing available”18. That unanimity is worth examining rather than invoking, because it has become more specific over time.
Same economists, same week, opposite answers
The Clark Center Forum’s US panel, asked three questions about New York housing on 12 November 2025.
Show the numbers
| Statement | Strongly agree | Agree | Uncertain | Disagree | Strongly disagree |
|---|---|---|---|---|---|
| A four-year rent freeze would substantially improve the availability of affordable housing | 0 | 6 | 8 | 47 | 40 |
| The same freeze would substantially deter private housing investment in the city | 29 | 56 | 11 | 3 | 0 |
| Loosening land-use rules would substantially boost private housing investment | 46 | 52 | 2 | 0 | 0 |
Confidence-weighted shares, as published by the Clark Center Forum; rows may not sum to 100 because of rounding. The chart plots strongly agree plus agree.
Asked in November 2025 whether a four-year freeze on New York’s rent-stabilised flats would “substantially improve the availability of affordable housing for low- and middle-income households”, six per cent of the panel agreed. Asked whether “Loosening land-use regulations and other regulation-related constraints on construction in New York (with no rent freeze) would be a substantial boost to private housing investment in the city over the next ten years”, ninety-eight per cent agreed27. Same people, same survey, same week: they believe something can be done, just not with a rent freeze.
The consensus has limits. When the European panel was asked in 2019 whether big European cities would be better off if governments did more to counter gentrification (through rent subsidies, public housing investment, zoning and so on), the answers scattered: 41 per cent uncertain, 42 per cent disagreeing, 16 per cent agreeing28. On the general question of whether the state should act on housing, economists are nothing like unanimous. What they will not defend is the price ceiling itself.
Build, then: the trouble with Houston
The alternative is to build, and it comes with a legend that needs some trimming.
The legend is that Houston abolished zoning, let anyone build anything anywhere, kept rents low as a result, and so proved that supply is the whole answer. Almost every part of that is shakier than it sounds. Houston has no zoning code, true, but it has deed restrictions, parking minimums and minimum lot sizes: 3,500 square feet inside the city and 5,000 in the extraterritorial jurisdiction, with smaller lots, down to an average of 1,400 square feet, allowed only if the developer adds open space or meets other standards29. Another rule lets the owners on a single block, or across a larger area, apply to fix a minimum lot size at the size that at least seventy per cent of their lots already meet30. On the standard academic measure of how regulated a housing market is, Houston is not an outlier at all. The Wharton index puts it within a tenth of a standard deviation of the national mean, in a group where “these markets have the average residential land use regulatory climate according to our measure”31.
Houston’s affordability has also been slipping. Median rent as a share of median household income rose from 18.8 per cent in 2010 to 21.7 per cent in 2024, while San Francisco’s stayed flat at 21.6 per cent. The weak side is income: Houston’s median household income grew the slowest of the ten big metros compared below, by 50.9 per cent, while its rents rose 73.6 per cent32. Houston builds a lot, and it is cheap. It has not been getting cheaper.
Tokyo is the better case, but it has caveats too. Japan’s consumer price index for private rents stands at 100.7 against a 2020 base, below where it stood in 1993, while the general price level rose about seventeen per cent: a real fall of roughly fifteen per cent over thirty-two years33. Nor is this an artefact of a shrinking city. Tokyo’s population rose from 11.8 million in 1995 to 14.2 million in 2024, and its share of a stagnant national population from 9.4 to 11.5 per cent34. Japan does build, under national rather than local land-use rules, and Tokyo adds almost twice as many homes to its stock per head as England does35.
But three things complicate the picture. The government’s other measure, the Housing and Land Survey, reports rents rising 7.1 per cent between 2018 and 202336. The two measure different things: the CPI follows the same dwellings over time, and Japanese rents rarely change within a tenancy, so it is the index least likely to move. Tokyo condominium prices are up about 136 per cent since 2012, while rents did not budge37. And roughly forty per cent of Japanese housing starts are offset by homes demolished or taken out of use, partly because a Japanese wooden house is written down to nothing in about two decades, so “housing starts” and “new homes” are not the same number38.
The cleanest demonstration comes from a place nobody puts on a poster.
Where metros built most, rents fell or barely rose
Homes authorised per 1,000 residents a year, 2021–2025, against the change in asking rents over the four years to August 2026. Austin is marked.
Show the numbers
| Metro area | Homes permitted per 1,000 residents a year, 2021–2025 | Asking rents, Aug 2022 to Aug 2026 |
|---|---|---|
| Austin | 15.5 | −10.8% |
| Houston | 9.1 | +3.6% |
| Phoenix | 9.0 | −1.0% |
| Dallas | 8.9 | −0.8% |
| Seattle | 5.3 | +7.5% |
| Miami | 3.4 | +6.0% |
| New York | 2.9 | +17.4% |
| Los Angeles | 2.3 | +8.3% |
| San Francisco | 2.0 | +17.8% |
| Chicago | 1.8 | +22.9% |
Austin permitted 15.5 homes per thousand residents a year over 2021–2025, about seventy per cent more than Houston and roughly eight times San Francisco’s rate39. Its asking rents fell 10.8 per cent between August 2022 and August 2026, by a wide margin the largest fall in the group and more than ten times the next largest40. The pattern down the chart is not subtle, and it does not come from picking Texas. Phoenix, at nine per thousand, held rents roughly flat, as Dallas did, while Chicago and San Francisco, at about two, saw rents rise 23 and 18 per cent.
The effect is real and large, but it works over years and is no magic wand. It took Austin a construction boom and about three years to deliver a ten per cent fall, and the fall is measured from the top of a pandemic surge: since August 2019 Austin’s asking rents are up 16 per cent, though that is still the smallest rise of the ten40. And the most-quoted number in the whole supply literature has just been revised toward zero. Hsieh and Moretti’s estimate that relaxing land-use rules in three cities would raise American GDP by 3.7 per cent drew a comment, published in the same journal, that reports a failed replication, errors in the code and, in a corrected model, an effect “two orders of magnitude smaller than what they report”4142. Building more housing lowers rents. It does not reorganise the economy.
The rest of the toolbox
If not a cap, then what? Each of the candidates has a real weakness, and it is usually the same one: the money leaks to the landlord.
Housing allowances are the instrument economists reach for, because they help poor tenants without distorting the price. The trouble is incidence: who ends up with the money. Gabrielle Fack’s study of the French system found that when the allowance per square metre rose by a euro, the rent per square metre rose by 78 cents: “78 % des aides au logement ont été absorbées par la hausse des loyers”43. Collinson and Ganong found that raising America’s voucher ceiling by a dollar raised voucher rents by 46 cents, and that “only (0.05/0.46 =) 11 percent of the increased government expenditure went to improvements in observable unit or neighborhood quality”44. A Finnish estimate of 60 to 70 cents did not survive when other researchers re-ran it on the same data, and their own study found that rents did not jump where the allowance did45. Germany’s own experience at least shows the fiscal scale: the Wohngeld reform of January 2023 took the caseload from 652,000 households to 1.17 million, and the bill from €1.8 billion to €4.3 billion, in a single year46. The money does real good, but in France and the United States a large slice of it ended up as rent.
Security of tenure is the underrated one. It delivers most of what a tenant wants, which is not to be moved, without setting a price. Kholodilin’s long-run index of rental regulation across 101 countries treats rent control, tenure security and rationing as three separate things, and finds that the world has quietly decoupled them: rent control “embarked on a slow but steady downward decline in regulation intensity” while tenure security “stabilized at a relatively high level around the world”47. German law is the model here: contracts are open-ended, and a landlord may not end a tenancy in order to raise the rent48. It is not free. Kholodilin notes that a tenanted flat in Germany sells for substantially less than an identical empty one47, so the cost shows up in the price of the asset rather than in the rent.
The smaller instruments are worth having and not worth overselling. A vacancy tax works on vacancy: the French version cut vacancy rates by about 13 per cent, though the study could not look at rents at all49. Curbs on short lets help a little. Berlin’s ban cut asking rents by up to about €30 a month for an average flat in the districts most popular with Airbnb, and its 2018 amendment had no measurable effect50. Neither is a housing policy on its own.
The verdict
So: does a Mietendeckel work?
Yes, at what it is for. It lowers the rent of the flats it covers, immediately, and it keeps sitting tenants in their homes, including those most likely to be displaced. These are real goods, and the people who campaign for caps know what they are asking for. Where the cap is mild and new building is exempt, as with Germany’s rent brake or Catalonia’s short-lived law, the damage is small enough that reasonable economists disagree about whether it exists.
And no, at what people hope it is for. It makes a set of tenancies affordable and rations entry to them, which is a long way from making a city affordable. Berlin’s hard version more than halved the number of flats advertised within weeks. While it lasted, rents rose nine per cent in the segment it could not reach and twelve per cent in the town next door, and four adverts in five named a rent above the ceiling. Three years after it ended, the flats it had covered were 10 to 15 per cent dearer than ifo’s comparison with other cities predicts. Stockholm’s soft, durable version produces a nine-year queue and a black market at a 72 per cent premium. Vienna, the best of these systems by a distance, gets its result from owning the housing rather than capping the rent, and it still awards up to 45 points for having lived there a long time.
The alternative is less satisfying to say out loud, because it is slower. Build enough, for long enough, and rents fall: Austin managed it, while the five metros building at under a third of Austin’s rate saw rents rise by between 6 and 23 per cent. It is a policy that takes years to pay off and has no ribbon to cut, which is why the instrument with the immediate effect keeps winning elections. But the choice is not between doing something and doing nothing. It is between a policy that helps the people in the room and one that helps the people who are still outside it.
This piece leaves one question open. Argentina repealed its rental law in December 2023, and the number of flats offered for rent in Buenos Aires more than doubled51, which everybody on one side of this argument now cites. But the only causal study is an unrefereed working paper, less sure of its price estimates than of its supply estimates, and it covers a period in which the country also had 211 per cent inflation and a recession51. The repeal may well turn out to be the best natural experiment of the decade. It is not evidence yet.
Sources
-
Bostadsförmedlingen i Stockholm, “Summering av året 2025”, retrieved 24 September 2026. Average queue time 9.0 years; 20,861 flats allocated; 894,592 registered, of whom 88,918 active. ↩︎ ↩︎
-
Bostadsförmedlingen i Stockholm, “Hur lång tid tar det att få en bostad genom oss?”, retrieved 24 September 2026. ↩︎ ↩︎
-
Gesetz zur Neuregelung gesetzlicher Vorschriften zur Mietenbegrenzung vom 11. Februar 2020, Artikel 1 (MietenWoG Bln), Gesetz- und Verordnungsblatt für Berlin vom 22. Februar 2020, S. 50. The Constitutional Court’s decision, below, reproduces §§ 1–11 except the rent table in § 6, which is in Drucksache 18/2347; § 3 Abs. 1 Satz 1 carries the freeze. ↩︎
-
Abgeordnetenhaus von Berlin, Drucksache 18/2347, Gesetzentwurf, 28 November 2019. The § 6 Abs. 1 rent table, the derivation from the 2013 Mietspiegel, and the estimate of about 1.5 million covered flats. ↩︎
-
Anja M. Hahn, Konstantin A. Kholodilin and Sofie R. Waltl, “Die unmittelbaren Auswirkungen des Berliner Mietendeckels: Wohnungen günstiger, aber schwieriger zu finden”, DIW Wochenbericht 8/2021, pp. 117–124. Abbildung 3 for the weekly advertisement medians: 698.5 before the announcement, 619 between announcement and entry into force, 263 in the four weeks after it. ↩︎ ↩︎ ↩︎
-
Mathias Dolls, Clemens Fuest, Florian Neumeier and Daniel Stöhlker, “Ein Jahr Mietendeckel: Wie hat sich der Berliner Immobilienmarkt entwickelt?”, ifo Schnelldienst 3/2021, 74. Jahrgang, 17 March 2021, pp. 26–32. The nine per cent is the change in average asking rents; footnote 3 for the 80 per cent and the two-rent clause in adverts. ↩︎ ↩︎
-
Senat von Berlin, “Sicher-Wohnen-Hilfe für Mieterinnen und Mieter”, press release, 20 April 2021. On shadow-rent contracts, repaying the difference, the interest-free loans and the estimate of about 40,000 Berliners who might need help. ↩︎ ↩︎
-
Bundesverfassungsgericht, Beschluss des Zweiten Senats vom 25. März 2021 – 2 BvF 1/20, 2 BvL 4/20, 2 BvL 5/20, ECLI:DE:BVerfG:2021:fs20210325a.2bvf000120. Tenor and Leitsätze 2–3. ↩︎
-
Mathias Dolls, Clemens Fuest, David Gstrein, Carla Krolage and Florian Neumeier, “Die Kosten des Regulierungsrisikos am Berliner Wohnungsmarkt”, ifo Schnelldienst digital 7(13), 14 August 2026, pp. 1–7; underlying paper CESifo Working Paper No. 12851. ↩︎ ↩︎
-
Jordi Jofre-Monseny, Rodrigo Martínez-Mazza and Mariona Segú, “Effectiveness and supply effects of high-coverage rent control policies”, Regional Science and Urban Economics 101 (2023), 103916, DOI 10.1016/j.regsciurbeco.2023.103916. Quoted from the accepted IEB working-paper version. ↩︎
-
Rebecca Diamond, Tim McQuade and Franklin Qian, “The Effects of Rent Control Expansion on Tenants, Landlords, and Inequality: Evidence from San Francisco”, NBER Working Paper 24181, January 2018. The welfare figures, the 5.1 per cent city-wide rent increase and the six per cent fall in city-wide rental supply are in this version, not in the published article. ↩︎ ↩︎ ↩︎
-
Rebecca Diamond, Tim McQuade and Franklin Qian, “The Effects of Rent Control Expansion on Tenants, Landlords, and Inequality: Evidence from San Francisco”, American Economic Review 109(9), September 2019, pp. 3365–3394, DOI 10.1257/aer.20181289. The figures by race are on p. 17 of the accepted manuscript. ↩︎
-
§ 556d BGB, Zulässige Miethöhe bei Mietbeginn, with §§ 556e and 556f on the Vormiete and the exemptions for flats first used and let after 1 October 2014 and for the first letting after comprehensive modernisation. The Rechtsverordnungen made under it must now expire by 31 December 2029. ↩︎
-
Claus Michelsen and Andreas Mense, Evaluierung der Mietpreisbremse, Endbericht des DIW Berlin für das Bundesministerium der Justiz und für Verbraucherschutz, 15 December 2018. p. 31 for the fall in rents on introduction, p. 48 for the effect on construction. ↩︎
-
Andreas Mense, Claus Michelsen and Konstantin A. Kholodilin, “Rent Control, Market Segmentation, and Misallocation: Causal Evidence from a Large-Scale Policy Intervention”, Journal of Urban Economics 134 (March 2023), 103513, DOI 10.1016/j.jue.2022.103513. The findings as stated in the open discussion-paper version, DIW Discussion Paper 1832, 2019; the journal text is not openly available. ↩︎
-
Johanna Neuhoff, Jan Sun (Oxford Economics) and Matthias Lehmann-Richter (HWR Berlin), Empirische und rechtswissenschaftliche Untersuchung des möblierten Mietwohnungsmarktes, Schlussbericht im Auftrag des Bundesministeriums der Justiz, June 2023, p. 7. ↩︎
-
Konstantin A. Kholodilin, “Rent Control Effects through the Lens of Empirical Research: An almost complete review of the literature”, DIW Discussion Paper 2026, 5 December 2022. Published as Journal of Housing Economics 63 (2024), 101983, DOI 10.1016/j.jhe.2024.101983. ↩︎
-
Richard Arnott, “Time for Revisionism on Rent Control?”, Journal of Economic Perspectives 9(1), Winter 1995, pp. 99–120, DOI 10.1257/jep.9.1.99. The 93.5 per cent figure is his, citing Alston, Kearl and Vaughan’s 1990 survey of American Economic Association members; it counts agreement and agreement with provisos. ↩︎ ↩︎
-
David H. Autor, Christopher J. Palmer and Parag A. Pathak, “Housing Market Spillovers: Evidence from the End of Rent Control in Cambridge, Massachusetts”, Journal of Political Economy 122(3), June 2014, pp. 661–717, DOI 10.1086/675536. The published abstract puts decontrol at about a quarter of $7.8 billion of Cambridge residential appreciation. ↩︎
-
David H. Autor, Christopher J. Palmer and Parag A. Pathak, “Housing Market Spillovers: Evidence from the End of Rent Control in Cambridge Massachusetts”, NBER Working Paper 18125, June 2012, p. 7. ↩︎
-
En mer flexibel hyresmarknad, SOU 2025:65, Statens offentliga utredningar, 28 May 2025, pp. 98 and 107. The 72 per cent Greater Stockholm premium (2016, from advertisements) is the inquiry’s citation of SOU 2017:86; the 200,000 estimate is Boverket’s. ↩︎
-
Statistik Austria, Wohnen 2025: Zahlen, Daten und Indikatoren der Wohnstatistik, from the Mikrozensus Wohnen 2025. p. 19 for Vienna’s shares of households (not of dwellings); Übersicht 2.2 for how long current tenancies across Austria have lasted. ↩︎ ↩︎
-
Justin Kadi, Lisa Vollmer and Samuel Stein, “Post-neoliberal housing policy? Disentangling recent reforms in New York, Berlin and Vienna”, European Urban and Regional Studies 28(4), 2021, pp. 353–374, DOI 10.1177/09697764211003626. Table 1 for the rent-burden comparison; quoted from the accepted manuscript. ↩︎ ↩︎ ↩︎
-
Stadt Wien – Wiener Wohnen, Wohnungsvergabe NEU: Vergaberichtlinien für geförderte und Gemeindewohnungen, version 5.4, 19 June 2026, via Wohnberatung Wien. Two years’ continuous main residence in Vienna; the Wien-Bonus awards up to 45 points for length of residence; applicants under 25 without a tenancy of their own get 50. ↩︎
-
Wiener Wohnbauförderungs- und Wohnhaussanierungsgesetz (WWFSG 1989), § 11, which requires eligibility at the moment of acquiring the right to a subsidised flat and sets no later re-test. ↩︎
-
Vienna.at, “Gemeindewohnung in Wien: Zehn Fragen zum günstigen Wohnen im Gemeindebau”, 15 May 2017. Wiener Wohnen’s spokeswoman Renate Billeth: income is checked when the tenant moves in and has no bearing on existing tenancies. ↩︎
-
Clark Center Forum, Housing in New York, survey of the US economic experts panel, 12 November 2025. Figures are confidence-weighted, as is the full distribution in the chart’s data table. ↩︎
-
Clark Center Forum, Gentrification, survey of the European economic experts panel, 30 April 2019. Figures are weighted by each panellist’s stated confidence. ↩︎
-
City of Houston, Ordinance Notes for Platting, 19 August 2026, pp. 11–14: lot-size averaging down to 1,400 square feet, and compensating open space for lots under 3,500 square feet in the city and under 5,000 in the extraterritorial jurisdiction. ↩︎
-
City of Houston, Code of Ordinances, chapter 42, secs. 42-197 to 42-202, on special minimum lot size blocks (one or two block faces) and areas (at least five block faces); the minimum is the size met by at least 70 per cent of existing lots, 60 per cent in historic districts. ↩︎
-
Joseph Gyourko, Jonathan Hartley and Jacob Krimmel, “The Local Residential Land Use Regulatory Environment Across U.S. Housing Markets: Evidence from a New Wharton Index”, NBER Working Paper 26573, December 2019, table 5 for Houston. Published as Journal of Urban Economics 124 (2021), 103337, DOI 10.1016/j.jue.2021.103337; quoted from the working paper. ↩︎
-
Own calculation from American Community Survey 1-year estimates, table B25064 (median gross rent) and table B19013 (median household income), for the ten metropolitan areas in the chart below, 2010 and 2024, retrieved 24 September 2026 from data.census.gov. ↩︎
-
Statistics Bureau of Japan, 2020-base Consumer Price Index, long-term item price indices, national annual averages 1970–2025, series “House rent, private” (e-Stat statInfId 000032103938), retrieved 24 September 2026. ↩︎
-
Tokyo Metropolitan Government, Tokyo Statistical Yearbook 2024, table 2-1, population of Tokyo-to and its share of the national total. ↩︎
-
Own calculation: Tokyo’s dwelling stock from the 2023 Housing and Land Survey (7.67 million in 2018, 8.20 million in 2023), against England’s net additional dwellings for 2018-19 to 2022-23 from MHCLG Live Table 120 and ONS mid-year population estimates. About 7.6 net new homes a year per 1,000 residents in Tokyo, against 4.2 in England. ↩︎
-
Statistics Bureau of Japan, 2023 Housing and Land Survey, basic tabulation on dwellings and households, 25 September 2024, section 7 on rents: “借家の1か月当たり家賃は7.1%の増加”. ↩︎
-
Ministry of Land, Infrastructure, Transport and Tourism, Real Estate Price Index, seasonally adjusted, 2010 average = 100; Tokyo-to condominiums, December values 2012 to 2025. ↩︎
-
Own calculation from the 2023 Housing and Land Survey total dwelling stock and MLIT housing-start statistics for FY2018–FY2022: net additions of about 527,800 a year against starts averaging 875,105. A wooden dwelling’s useful life for tax purposes is 22 years (National Tax Agency). ↩︎
-
Own calculation from the US Census Bureau Building Permits Survey, annual metropolitan and CBSA files, and Vintage 2025 population estimates; units authorised per 1,000 residents, annual average 2021–2025, retrieved 24 September 2026. ↩︎
-
Zillow Observed Rent Index, smoothed, all homes plus multifamily, metropolitan series, August 2022 to August 2026, retrieved 24 September 2026. ZORI is a repeat-rent index of asking rents on new leases, not of rents paid by sitting tenants. ↩︎ ↩︎
-
Brian Greaney, “Housing Constraints and Spatial Misallocation: Comment”, American Economic Journal: Macroeconomics 18(2), April 2026, pp. 409–428, DOI 10.1257/mac.20230141. ↩︎
-
Chang-Tai Hsieh and Enrico Moretti, “Housing Constraints and Spatial Misallocation”, American Economic Journal: Macroeconomics 11(2), April 2019, pp. 1–39, DOI 10.1257/mac.20170388. ↩︎
-
Gabrielle Fack, “Pourquoi les ménages à bas revenus paient-ils des loyers de plus en plus élevés ? L’incidence des aides au logement en France (1973-2002)”, Économie et Statistique 381–382, 2005, pp. 17–40. The English companion is “Are housing benefit an effective way to redistribute income? Evidence from a natural experiment in France”, Labour Economics 13(6), 2006, pp. 747–771, DOI 10.1016/j.labeco.2006.01.001. ↩︎
-
Robert Collinson and Peter Ganong, “How Do Changes in Housing Voucher Design Affect Rent and Neighborhood Quality?”, American Economic Journal: Economic Policy 10(2), May 2018, pp. 62–89, DOI 10.1257/pol.20150176. The paper’s own text writes the figure as “$0.46 cents”; it is 46 cents. ↩︎
-
Essi Eerola and Teemu Lyytikäinen, “Housing Allowance and Rents: Evidence from a Stepwise Subsidy Scheme”, Scandinavian Journal of Economics 123(1), 2021, pp. 84–109, DOI 10.1111/sjoe.12396. Appendix B of the working-paper version re-runs Kangasharju (2010) on the same data and does not reproduce his result; the main finding is that rents do not jump at the allowance thresholds. ↩︎
-
Statistisches Bundesamt, Wohngeldstatistik: households in receipt at 31 December (651,825 in 2022; 1,173,550 in 2023) and total expenditure (€1,825.0m in 2022; €4,317.1m in 2023). Expenditure from reporting year 2013 is collected by the BMWSB, and the 2022–2025 figures include the temporary Heizkostenzuschuss. ↩︎
-
Konstantin A. Kholodilin, “Long-Term, Multicountry Perspective on Rental Market Regulations”, Housing Policy Debate 30(6), 2020, pp. 994–1015, DOI 10.1080/10511482.2020.1789889. Separate indices for rent control, tenure security and housing rationing across 101 countries, 1910–2020. p. 997 for tenanted against vacant dwellings in Germany, citing Kholodilin, Mense and Michelsen (2017); p. 1007 for the quotations. ↩︎ ↩︎
-
§ 573 BGB, Ordentliche Kündigung des Vermieters, which rules out notice given in order to raise the rent; § 575 allows a fixed term only for the reasons it lists. ↩︎
-
Mariona Segú, “The impact of taxing vacancy on housing markets: Evidence from France”, Journal of Public Economics 185 (2020), 104079, DOI 10.1016/j.jpubeco.2019.104079. The paper estimates effects on vacancy and prices; it does not estimate effects on rents. ↩︎
-
Tomaso Duso, Claus Michelsen, Maximilian Schaefer and Kevin Ducbao Tran, “Airbnb and rental markets: Evidence from Berlin”, Regional Science and Urban Economics 106 (2024), 104007, DOI 10.1016/j.regsciurbeco.2024.104007. The €30 a month is from the working-paper version, Bristol Economics Discussion Paper 21/746, 2021. ↩︎
-
Martin Elfert and Stephan L. Thomsen, “The Impact of the Chainsaw-Liberation on the Rental Housing Market in Buenos Aires”, Hannover Economic Papers 741, Leibniz Universität Hannover, 1 September 2025. A working paper, not refereed; the authors describe their own price estimates as less robust than their supply estimates. ↩︎ ↩︎


.jpg)


