In May 2026 Capri-Sun stopped collecting signatures. The drinks maker from Eppelheim in Baden-Württemberg had turned to the public in August 2024 to win back a plastic straw for its pouches, which have come with a paper one since the European Union banned plastic straws in 2021. “We need 1 million signatures to show the European Commission why this matters”, its petition said. On 17 November 2026 the counter stood at 169,079, and an update dated 12 May says “the petition is no longer active”1. The company told the trade paper Lebensmittel Praxis what its customers complain of, and most drinkers will recognise it: the paper straw is harder to push into the pouch, goes soft during drinking and leaves a taste of paper2.
The straw Capri-Sun wants back has been illegal to sell in the EU since 3 July 2021. Directive 2019/904 obliges the member states to prohibit single-use plastic straws, medical devices excepted, along with plastic cutlery, plates, stirrers and cotton-bud sticks, among other things3. Germany did so in its Einwegkunststoffverbotsverordnung4. The directive gives its reason in one sentence of recital 15, one of the numbered reasons that precede an EU law: for these products “suitable and more sustainable alternatives that are also affordable are readily available”3.
The alternative that cafés and drink makers mostly reached for was the paper straw. Whether it is more sustainable depends on what is asked. Dropped in the sea, a paper straw is gone in about a year and a plastic one is not. On most other counts the evidence runs against paper or is split. The paperwork behind the ban is thinner than recital 15 suggests. Brussels had a comparison of the two straws that covered their manufacture only, showed paper emitting more than plastic, and was not printed in the impact assessment. Berlin made none. London’s own sums said that paper adds emissions worldwide.
The case against the plastic straw
On 10 August 2015 a team of biologists surveying olive ridley turtles off the Pacific coast of Costa Rica found one with something lodged in its nostril. They pulled, with a camera running, and out came a plastic drinking straw 10 cm long. The turtle bled, recovered and swam away5. By November 2026 the eight-minute video had been watched almost 117 million times6.
The video made the straw the emblem of plastic in the sea, and the beach counts gave it some support. Volunteers of the Ocean Conservancy’s International Coastal Cleanup have picked up 16.3 million straws and stirrers since 1986, which makes them the fifth most common item on its list7. A straw is light, it is used outdoors, and it is too small for a sorting plant to catch. Britain’s environment ministry assumed in its sums “that zero straws recycling occurs for either plastic or paper straws”8.
And polypropylene, the plastic of the classic straw, lasts. Chemists at the Woods Hole Oceanographic Institution in Massachusetts kept straws of five materials in flowing seawater for 16 weeks. The paper straws and two kinds of biodegradable plastic lost up to half their mass, which projects to a lifetime of 10 to 20 months in the coastal ocean. “PP and PLA showed no measurable mass loss”9. PP is polypropylene; PLA is the plant-based plastic often sold as compostable. That study was paid for and co-written by Eastman, a maker of one of the biodegradable plastics tested10. A second study from the same laboratory, funded by the US National Science Foundation, came to the same result in 2025. It projects 11 months for the paper straw and at least 1,800 months, or 150 years, for the polypropylene ones11.
So the directive’s logic holds as far as it goes. A paper straw that escapes into the sea is a nuisance for a year, a plastic one for generations.
Twice the weight
A paper straw has little in common with a sheet of writing paper. It is a tube of several plies of virgin-fibre paper12, held together with glue13. The paper is treated to repel water14 and contains a wet-strength resin, so that the tube does not collapse in the drink15.
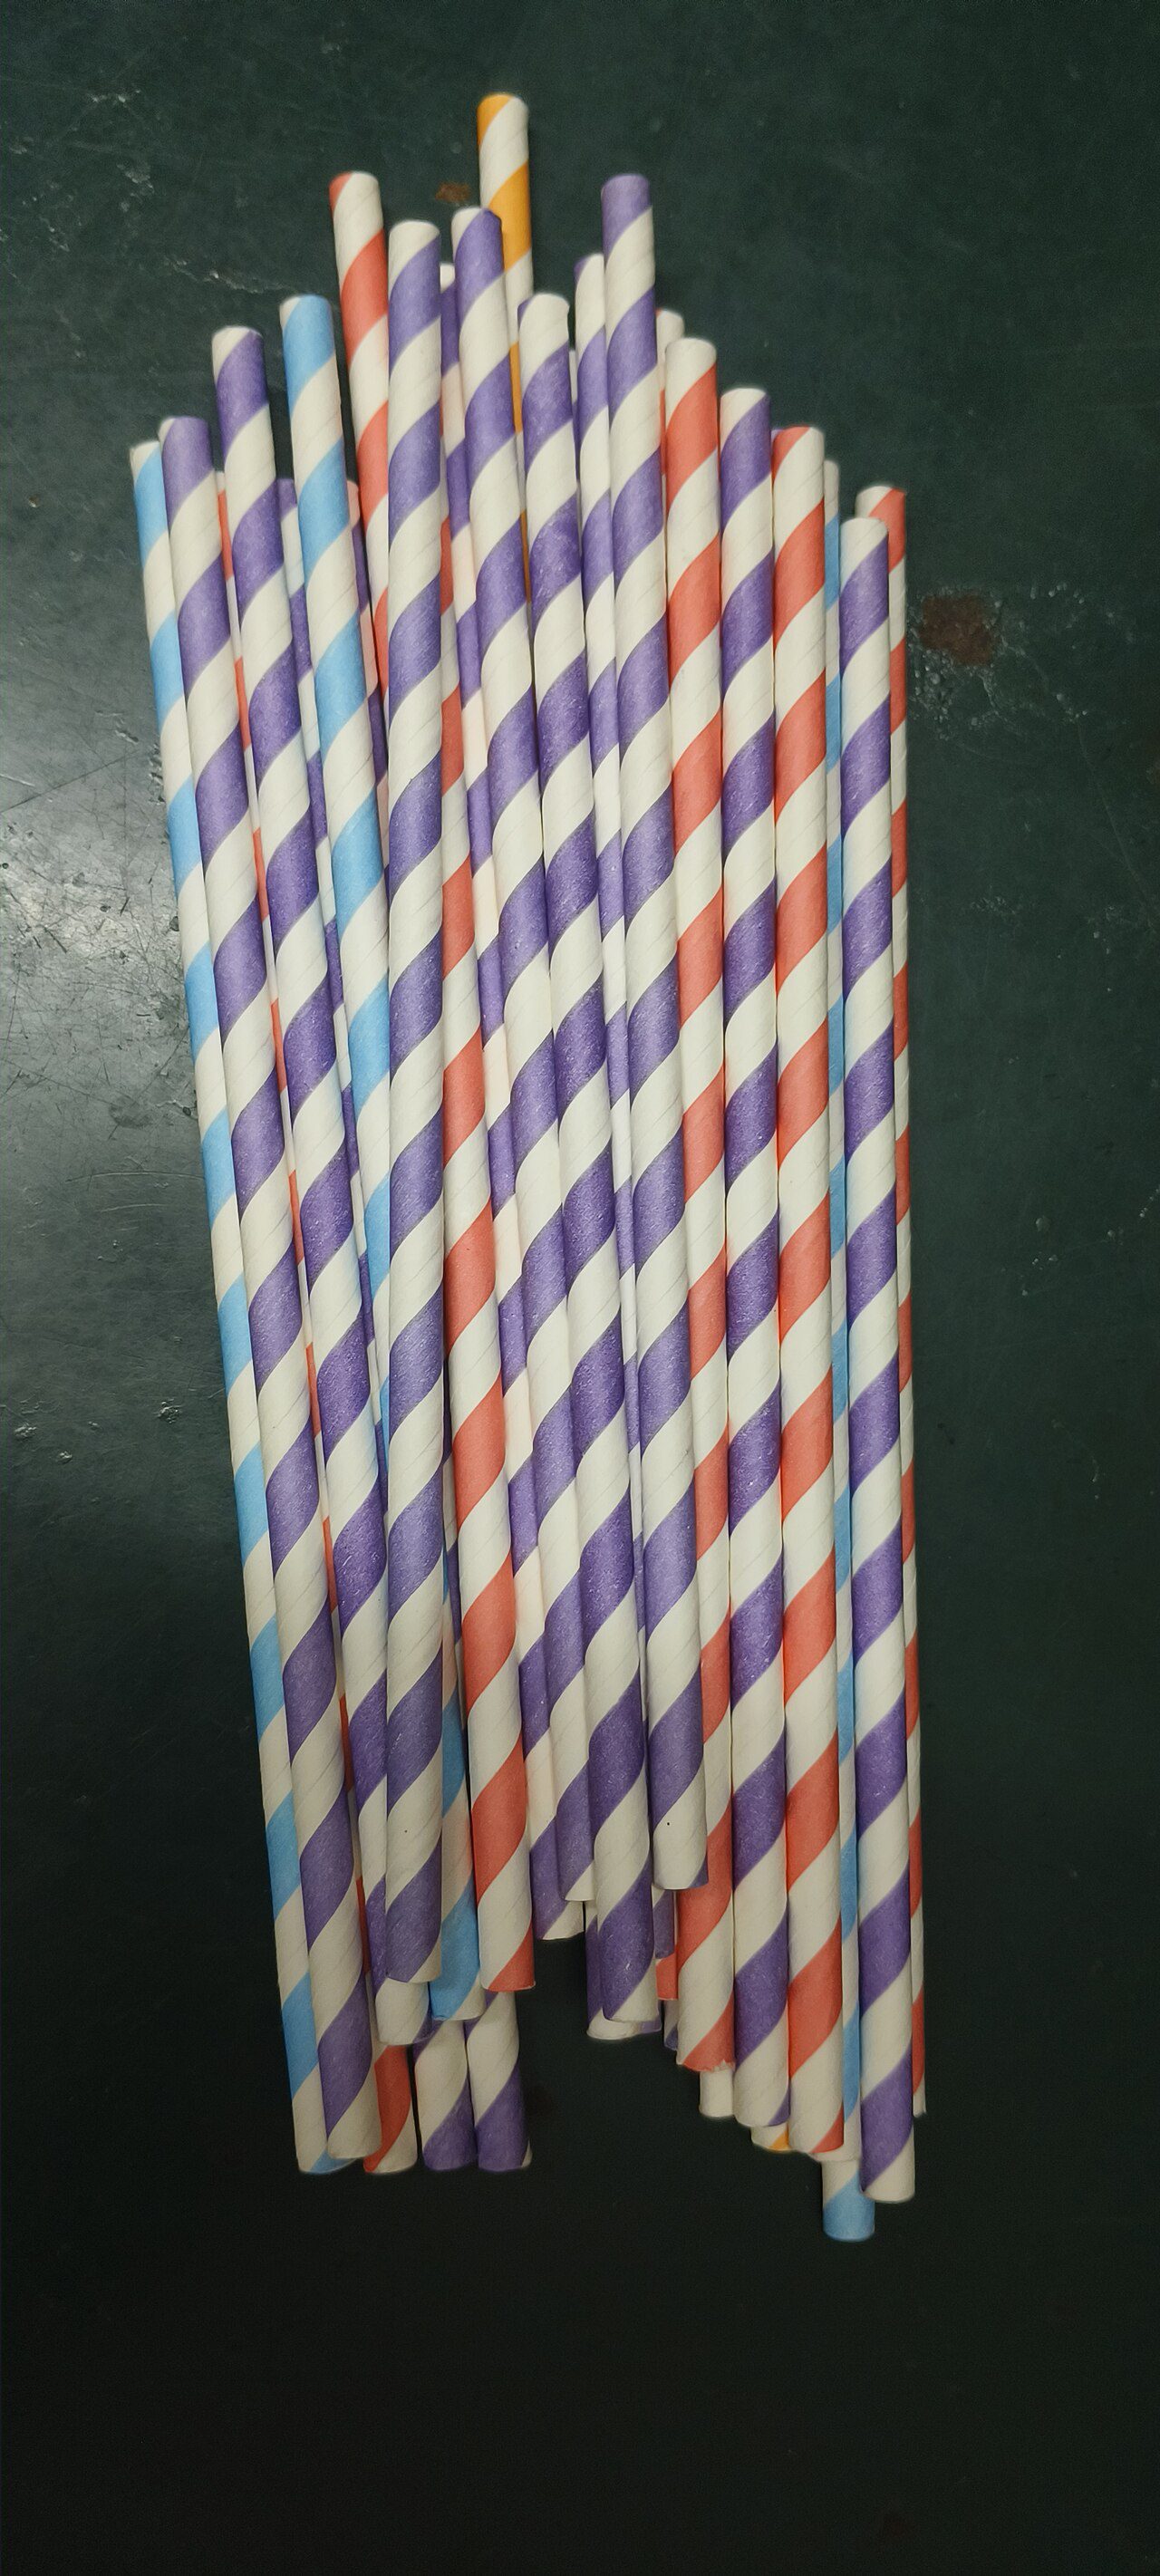
The result is heavy. Researchers at North Carolina State University weighed three paper straws at 1.09 to 1.14 g and two plastic ones of similar size at 0.47 and 0.56 g. The paper walls were 0.40 to 0.46 mm thick, the plastic ones 0.06 to 0.07 mm14. The Woods Hole group weighed 1.13 g against 0.61 g11. The British government assumed 1.18 g against 0.55 g and wrote: “Paper straws weigh approximately double plastic straws”8.
That holds for the full-size straw of a café. The short, thin straw glued to a drink carton or a pouch, Capri-Sun’s kind, is another matter: in a study for Tetra Pak it weighs 0.39 g in paper and 0.40 g in plastic16.
Weight matters because most of what a product does to the environment before it is thrown away grows with the amount of material in it. A substitute that needs twice the material has to be twice as clean per gram just to draw level.
What the life-cycle studies say
A life-cycle assessment, or LCA, adds up the emissions and the resources a product takes from raw material to disposal. We found eight that compare paper and polypropylene straws over the whole life cycle and whose numbers can be checked, from the United States, Europe and South Africa. On climate they disagree. The chart shows seven of them; the eighth gives only a ratio.
Seven studies, no agreement on climate
Greenhouse gases per straw, in grams of CO2 equivalent, paper against polypropylene, from the seven life-cycle studies that give a figure per straw or one that can be converted. Gao and Wan computed two disposal routes.
Show the numbers
| Study | Setting | Paper straw, g CO2e | Plastic straw, g CO2e | Paper as a multiple of plastic |
|---|---|---|---|---|
| Gao & Wan 2022 | United States, landfill | 5.16 | 1.13 | 4.56 |
| Gao & Wan 2022 | same, every straw burnt | 5.40 | 2.78 | 1.94 |
| Rana 2020 | United States, landfill | 4.11 | 1.47 | 2.80 |
| Eleni & Boukouvalas 2025 | Greece, 2.5 g paper straw | 4.12 | 1.68 | 2.45 |
| Herberz et al. 2020 | EU, landfill and burning | 1.2 | 1.4 | 0.86 |
| thinkstep for Tetra Pak 2019 | carton straw, 0.39 g in paper | 0.65 | 0.97 | 0.66 |
| Takou et al. 2019 | Denmark, burnt for energy | 0.94 | 2.9 | 0.32 |
| Chitaka 2020 | South Africa, plastic from coal | 3.31 | 5.69 | 0.58 |
Four find the plastic straw the lower emitter. Two are American studies that assume the used straw is buried in a landfill1718. One is from Greece19, and one is a Swedish master’s thesis written with a retailer’s data, which puts paper 30% above plastic13. A Brazilian study agrees, to judge by its abstract; three of its five authors are listed at Braskem, a maker of polypropylene20. Three find paper lower: a study for the Danish environment agency21, the one paid for by Tetra Pak, which sells drink cartons with paper straws16, and a South African doctoral thesis22. One, by researchers in Cambridge and Berlin, finds the two about even23. In October 2026 the Korea Herald reported a study commissioned by South Korea’s environment ministry in which plastic did best in 10 of 16 categories, climate among them. We could not obtain the study itself24.
The disagreement has four causes that can be named. The first is weight. Where the paper straw is as light as the plastic one, as on Tetra Pak’s cartons, paper wins. The Greek and Swedish studies assume paper straws of 2.5 and 2.6 g, more than twice the weight of any paper straw in the measurements above and five times that of their plastic ones, and there paper loses1913.
The second is what happens to the straw afterwards. Paper buried in a landfill rots and gives off methane; paper burnt in a plant that sells the heat earns a credit for the fuel it replaces. The American studies assume landfill, the Danish one assumes that every paper straw is incinerated with energy recovery. The third is what the plastic is made from. South Africa makes its polypropylene from coal, at 9.67 kg of CO2 equivalent per kilogram of resin against 1.97 kg in Europe, by the thesis’s own figures22.
The fourth is how clean paper-making is taken to be. Per gram of paper straw, the studies’ totals run from 0.8 g of CO2 equivalent in the Danish study to 4.5 g in the American one by Gao and Wan (own calculation from their tables). Burning the straw therefore does not settle the matter. Gao and Wan also computed a variant in which every straw is incinerated, without a credit for the energy, and paper still came out at almost twice the plastic figure17. The Korean study, as reported, assumed that 74% of straws are burnt.
For Germany the second cause is settled. Only 0.5% of German municipal waste went to landfill in 202425, so a straw in the residual bin is burnt, whichever material it is made of. The landfill methane that sinks paper in the American studies does not arise here. The Woods Hole group’s figures point the same way: making a paper straw causes 0.8 g of CO2 equivalent, the second-lowest figure among the 13 straws it examined, and the methane from a landfill adds 4.6 g or more to a straw that rots11. Two European studies assume incineration with energy recovery. The Swedish one has paper 30% above plastic, with its 2.6 g straw. The Danish one, whose straw weighs 1.19 g, has paper at a third of plastic. On climate, a paper straw of ordinary weight in Germany probably does no worse than a plastic one and may do better.
Climate is one category among several, and in the others the studies agree more.
Outside climate, the studies mostly agree
Which straw does better in each impact category, in the six life-cycle studies that report results by category. 'Even' means that paper is within 15% of plastic; a dash means not reported.
Show the numbers
| Study | Climate | Fossil energy | Acidification | Eutrophication | Toxicity |
|---|---|---|---|---|---|
| Gao & Wan 2022, United States, landfill | 4.56 | 0.46 | 2.19 | 4.41 | 4.4–7.1 |
| Hoge 2019, EU, 2.6 g paper straw | 1.30 | 1.11 | plastic below zero | plastic lower | 2.2–3.9 |
| Herberz et al. 2020, EU, landfill and burning | 0.86 | 0.34 | 2.1 | 8.0 | 16.7 |
| thinkstep for Tetra Pak 2019, carton straw | 0.66 | 0.61 | 2.24 | 2.4–3.7 | – |
| Takou et al. 2019, Denmark, burnt for energy | 0.32 | 0.42 | 1.9 | 1.0–6.9 | 1.3–1.8 |
| Chitaka 2020, South Africa, plastic from coal | 0.58 | paper lowest | paper lower | fresh water: paper lower; sea: plastic lowest | human: paper lower; soil: plastic lowest |
Paper needs less fossil fuel in five of the six studies that report results by category. It does worse on acidification, the emissions that turn rain and soil acid, and on eutrophication, the over-fertilising of water and soil, in five of the six, and on toxicity in four of the five that report it. On those three the exception is the South African study with its coal-based plastic. The Danish report shows how far a summary can drift from its table. It concludes that paper straws perform “better or on the same level” as polypropylene ones21, on the strength of the few categories it examined in depth, climate among them. Across all 14 categories in its results table, paper is better in three, level in two and worse in nine (own count).
Paper also takes more water. By the figures the Woods Hole group uses, making a kilogram of paper takes 1,700 litres and a kilogram of polypropylene 32. For straws of the weights they measured, that is about 1.9 litres for a paper straw against 0.02 for a plastic one (own calculation)11.
Most of these studies leave out the thing paper is clearly better at. “This study does not address marine litter as no LCA metrics have yet been developed for this issue”, says the Tetra Pak report16. The Danish one leaves littering out because it is “the reason for the suggested ban”21. Three try to count it. The Cambridge and Berlin study adds up the plastic that reaches the sea23. Gao and Wan gave the plastic straw a litter score of 1 and the paper straw 0, and found plastic still ahead overall unless litter is weighted 2.7 times as heavily as any other category17. The Woods Hole group put a price on persistence: a littered straw that does not last saves society about 0.3 US cents11. That leaves two findings which are hard to add up. Paper is the better litter and, on most other counts, the worse product. Which of the two matters more depends on how much litter and how much product there is.
How big is a straw
Not much product, to begin with. The studies put one straw at roughly 1 to 6 g of CO2 equivalent, and the two straws at most 4 g apart. Tetra Pak’s report offers a comparison. An empty 200 ml drink carton accounts for 9.9 g and its plastic straw with wrapper for 1.0 g. Replacing that straw with a paper one lowers the total for carton and straw by 3%16.
Three ways of measuring the straw problem
The share of straws and stirrers in litter on coasts, by count, and of straws in the plastic that reaches the sea, by weight.
How much litter depends on who counts. In the worldwide volunteer cleanups, straws and stirrers are 3.7% of the 439 million items collected since 19867. Europe’s official monitoring gives a smaller share. In 2016, surveyors recorded 355,671 items on 276 European beaches. Only 566 of them, or 0.16%, were logged as straws and stirrers, but that is a floor: on the North-East Atlantic and the Baltic, surveys record straws together with cutlery, a category that makes up another 1.0%. On the Mediterranean and the Black Sea, where straws and stirrers are counted on their own, they are 0.7% and 0.5% of all items26. The volunteer count and the official one use different methods and cover different coasts, so they should not be mixed. On European beaches the straw is somewhere below 1.2% of the litter and far down the list.
By weight the straw almost disappears. The only estimate we found of the straws lying on the world’s coastlines is one that two Australian scientists gave the Associated Press in 2018: between 437 million and 8.3 billion27. At the 0.42 g per straw the agency used, that is 180 to 3,500 tonnes. The standard estimate of the plastic that enters the oceans is 4.8 to 12.7 million tonnes a year28. The highest straw figure set against the lowest inflow comes to 0.07%, and to 0.1% with a heavier straw of 0.61 g (own calculation). That compares all the straws lying on the coasts with a single year’s inflow, which overstates their share.
Little of that inflow starts in Europe. A model of the plastic that rivers alone carry to the sea puts the world total at 0.8 to 2.7 million tonnes a year29. In the country figures derived from it, Europe accounts for 0.6% and Germany for 134 tonnes of plastic of every kind30. Such figures flatter rich countries, which ship part of their plastic waste abroad: a study that counted exports and illegal dumping put the United States’ contribution “among the highest in the world”31. Britain’s environment ministry assumed that 0.1% of the 4.7 billion straws England used in a year end up in the sea8. That is 4.7 million straws, or about 2.6 tonnes of plastic (own calculation). The Cambridge and Berlin study estimated that the EU’s whole ban on single-use plastics, of which straws are one item, would cut marine plastic pollution by 5.5% in the EU and by 0.06% worldwide23.
The evidence of harm is thinner than the video suggests. The biologists who filmed the turtle called their find “a single example” of what plastic debris can do5. A survey of experts, co-written by staff of the Ocean Conservancy, ranked 20 kinds of litter by the harm they are expected to do to seabirds, turtles and marine mammals. Fishing gear took the first three places. Straws and stirrers came 13th, although the experts rated them high for the risk of being swallowed32.
The numbers that made the straw look large are weak. The figure of 500 million straws a day in the United States comes from a boy who was nine when he telephoned three manufacturers in 2011 and averaged their answers. A market researcher puts it near 175 million33. The 36.4 billion a year often quoted for the EU was scaled up from a campaign group’s guess at how many straws McDonald’s hands out in Britain, 3.5 million a day. It “was the only figure available on the consumption of drinking straws in the EU”34. McDonald’s later gave the British government its own number: 1.8 million8. The Commission’s consultants took 207 billion from a market report35, nearly six times the campaigners’ figure. Germany’s environment agency said in 2018: “Uns liegen keine verlässlichen Daten zum Verbrauch von Strohhalmen vor” (we have no reliable data on the consumption of straws)36.
What the lawmakers checked
Brussels did have a comparison. Consultants compiled a life-cycle inventory for the Commission, dated December 2017, of the emissions to air from making each banned product and its substitutes. For straws it lists 1.39 g of fossil CO2 for a paper straw against 1.03 g for a plastic one, a third more. A reusable straw of steel or silicone comes to 1.68 to 4.19 g per use, washing included. Reusable straws, the authors wrote, are “consistently the worse-performing of all alternatives” in their group. They also warned that the figures were inputs to a larger model and no verdict on which product to prefer37.
The impact assessment of May 2018 printed none of these numbers. It says that a life-cycle analysis was undertaken and that “there might be a minor increase in land use due to a switch to paper and wood”. Its annex states what the analysis covered: greenhouse gases and air pollutants only, and “End-of-life treatment is excluded from the LCI scope”, the scope of the inventory38. In the consultants’ model the paper straw weighs 0.8 g, a number marked as an estimate35. The paper straws weighed above came to 1.09 to 1.14 g.
The model’s larger assumption is about what would replace the plastic straw.
The ban the Commission modelled had little paper in it
What was assumed to replace every 100 plastic straws once they were banned, in the model behind the EU impact assessment of 2018.
Show the numbers
| Of 100 plastic straws | Number | Assumption in the model |
|---|---|---|
| Not replaced | 50 | overall demand falls by 50% |
| Reusable straws | 45 | 90% of the remaining demand |
| Single-use non-plastic straws | 5 | 10% of the remaining demand |
For a levy or a reduction target, the impact assessment assumes that the use of straws falls by half “as consumers decide they no longer need the items at all”38. The consultants’ annex applies the same halving to a ban, and has 90% of what remains met by reusable straws and 10% by single-use substitutes such as paper. A steel straw is assumed to be used 5,412 times over ten years35. On the inventory’s own figures a reusable straw emits more per use than the plastic one it replaces, so the saving the model shows for straws must come mainly from the half that is no longer used (own inference).
There is no official count of what replaced the plastic straw, or of whether fewer straws are used. The nearest thing is a survey for the British government in 2025, in which 85% of respondents had used a paper straw in the past 12 months39.
Germany made no comparison of its own. The official reasoning for the German ban cites recital 15 and says that “geht der EU-Richtliniengeber davon aus” (the EU legislator assumes) that suitable, more sustainable and inexpensive alternatives exist. To estimate how many plastic straws were affected, the statistical office assumed, according to the reasoning, “ein Trinkhalm ca. 2 g” (a straw at about 2 g), about four times the weight of a real one40. In 2021 a citizen petitioned the Bundestag to ban paper straws, arguing that they are at least as harmful to make as plastic ones. The petitions committee closed the case in 2022 without defending paper. It pointed to reusable straws instead, “beispielsweise durch Trinkhalme aus Edelstahl oder Glas” (for example straws of stainless steel or glass)41. The federal environment agency knows the problem from another product. Its questions and answers on the plastics directive say: “So haben Papiertragetaschen in der Regel eine schlechtere Ökobilanz als Kunststofftragetaschen” (paper carrier bags usually have a worse life-cycle balance than plastic ones)42. On paper straws the page says nothing.
England banned plastic straws on 1 October 2020, and the British government did do sums. They put the ban’s costs £44.7 million above its benefits. The carbon part used general factors per tonne of paper and of plastic, not a study of straws. The impact assessment conceded: “Globally, paper straws will add emissions compared to plastic through being heavier and through emitting more emissions when placed in landfill.” For Britain alone it booked a net saving of 706 tonnes of CO2 equivalent over ten years, because burning paper emits less than burning plastic. It counted nothing for making the straws, because straws are imported8. A review in 2022 found that “it was not possible to examine whether the restrictions have impacted the amount of plastic straw litter”. It recommended finding out what the substitute straws are made of “and what their environmental impact is”43. The full review of 2025 offers no such comparison for straws, and it sees straw litter only through beach counts that lump straws with cutlery and trays. Plastic litter had fallen, it says, but “it is not clear how far this change can be attributed to the Regulations”. In its survey, 56% of people who had bought straws in a supermarket said that plastic ones were still on sale, though the review warns that some may have taken compostable straws for plastic39.
Europe has no measurement either. The EU’s research centre reports that single-use plastic items on EU coasts fell by 40% between 2015–2016 and 2020–202144. The comparison ends in the year the ban took effect, so the ban itself can explain little of the fall, though some sellers had switched earlier. The report has no figure for straws. In the worldwide cleanups, straws and stirrers were 2.9% to 4.1% of all items in the years 2013 to 2019. From 2020 to 2025 they were 2.6% to 3.2%, except in 2024, when they fell out of the top ten and below 2.3%45. That is a modest decline at most, and most of those cleanups take place in countries without a ban. The one before-and-after study we found is an American master’s thesis of 2025, which we read in abstract only. It finds straw bans in American states and cities “weakly effective” against straw litter, and rules that make straws available only on request without effect46.
The directive itself asks for the missing comparison. The Commission must evaluate it by July 2027, and the evaluation “shall, wherever possible, include an overall life cycle analysis” of the products the directive covers and their alternatives3. The Commission began work on it with a call for evidence in December 202547. A full comparison of the alternatives that recital 15 called more sustainable is thus due eight years after the directive was passed.
Paper is the better litter and, on most other counts, the worse product.
In the glass
Capri-Sun’s customers have a point. The North Carolina researchers found that “all the evaluated paper straws lost 70% to 90% of their compressive strength after being in contact with the liquid for less than 30 min”14. The German consumer magazine Öko-Test had 20 paper straws tasted by a panel in 2024: “So schmeckten fast alle Halme nach Papier” (almost all the straws tasted of paper)48. In the survey for the British review, 47% of people who had used paper straws were dissatisfied with them, which made paper straws “the most negatively rated alternative item”39.
The company’s own argument is about recycling. Its pouch is made of polypropylene, the paper straw mostly stays inside it2, and so, the petition says, “the paper straw contaminates the plastic recycling stream”1. We found no independent test of that claim.
For some people the matter is more than a nuisance. Many disabled people need a straw that bends and survives being bitten, and paper ones, as the American broadcaster NPR put it, “often fall apart too quickly”49. England therefore still lets pharmacies sell plastic straws and restaurants hand them out on request50. After the Dutch food-safety authority asked the public in 2022 to report problems with paper straws, it received about 1,300 reports, ranging from annoyance to possible cases of near-choking. The health minister told parliament that no case of actual suffocation was known51. Finland’s food authority issued a warning to parents the same year52.
Paper straws also cost more. The British government assumed a wholesale price of 0.65p for a plastic straw and 2.5p for a paper one, about four times as much8. The Commission’s consultants used €0.012 and €0.092, nearly eight times as much35.
Two chemical scares are smaller than they sound. In 2023 chemists at the University of Antwerp reported PFAS, the persistent fluorinated compounds, in nearly all of the 20 brands of paper straw they tested. The highest reading was 7.15 nanograms per gram53. The publisher’s press release counted 18 brands of 20, and also three of the four plastic brands, and judged that the amounts “pose a limited risk to human health”54. An American study of 2021 found a median of 0.55 nanograms per straw in 38 brands of paper and other plant-based straws55. The EU’s limit for drinking water is 100 nanograms per litre56, so a median straw holds as much PFAS as about a teaspoon of tap water at the legal limit (own calculation).
German food inspectors found something better documented: chloropropanols, by-products of the wet-strength resin. In a nationwide programme in 2020, 16 of 32 paper straws exceeded the official guide value. “Besonders häufig wurde bei Trinkhalmen die BfR-Empfehlung nicht eingehalten” (the recommendation was missed especially often in straws), the federal food-safety office wrote. The same report says that the guide value marks what is technically avoidable and is not a health threshold57. Manufacturers seem to have fixed the fault. Bavaria’s food-safety office found three of 30 straws over the value in 202158. Öko-Test found none in 20 in 2024, though it marked some straws down for other substances48.
A used paper straw is not waste paper. Germany’s environment agency lists straws among the wet-strength papers that do not belong in the paper bin and sends them to residual waste59. Öko-Test adds that they do not belong in the organic bin either, whatever the packet says48. When McDonald’s switched to paper in Britain in 2019, it had to tell its restaurants to put the straws in general waste, because “their current thickness makes it difficult for them to be processed”60. In Germany a used straw of either material goes to the incinerator.
The other straws
The reusable straw, on which the Commission’s model leaned, is better only with discipline. In the South African study a glass straw has to be used 23 times and a steel one 37 times, washed cold by hand, before it beats the plastic straws it replaces on climate22. An American thesis found that “Over 85 percent” of a steel straw’s footprint over a year comes from washing it. Washed with hot water after each of 584 uses in a year, the steel straw caused 35.9 kg of CO2 equivalent, against 0.86 kg for 584 plastic straws and 2.4 kg for 584 paper ones. It came out ahead only when washed cold and briefly18.
The compostable plastic straw is no way out. The directive counts plant-based plastics such as PLA as plastic and bans them too3, and in the Woods Hole tank PLA lasted as well as polypropylene did.
Two countries have gone the other way. South Korea suspended its ban on plastic straws in November 202361 and has since moved to handing them out only on request6263. In February 2025 President Trump ordered the federal government to stop buying paper straws, which his order calls “nonfunctional”64. The strategy paper his staff published a month later concedes more than the order does: “There is no consensus about whether paper or plastic straws lead to more air pollution or other emissions”65.
The cheapest alternative is in the consultants’ annex of 2018: “For many drinks, straws and stirrers are not needed at all, and could simply be eliminated”35. A straw that is not handed out weighs nothing, costs nothing and cannot be littered. Some cities now make the point with a price. Potsdam has charged 20 cents on every disposable straw longer than 10 cm since October 2026, as The Ten-Centimetre Fork describes.
The verdict
Is the paper straw better for the environment than the plastic one? As litter, yes. A paper straw in the sea is gone in about a year, and a plastic one stays for generations. Most life-cycle studies do not count this, and it is the reason for the ban.
As a product, mostly no. A café paper straw takes twice the material and far more water, and it does worse on acidification, over-fertilising and toxicity in most studies. It needs less fossil fuel in five of six. On climate the result runs from a third of the plastic straw’s emissions to four and a half times as much, depending on the weight of the straw, the fate of the waste and the figure assumed for paper-making. In Germany, where waste is burnt, a paper straw of ordinary weight probably does no worse than a plastic one and may do better.
Both effects are small. The choice of straw moves a drink’s footprint by 4 g of CO2 equivalent at most. Straws, counted with stirrers, are below 1.2% of the litter on European beaches and 3.7% in the worldwide cleanups. On the one rough estimate there is, straws are about 0.1% at most of a year’s plastic inflow to the sea. A country that burns its waste sends few straws of either kind to the sea, as far as the estimates go, so paper’s clearest advantage is seldom called on. Its costs are paid with every drink taken through one: the price, the taste and the softening. Whether fewer straws are used since the ban, which would be its best result, nobody has counted.
Recital 15 said in 2019 that more sustainable alternatives were readily available. That holds for the straw that is not handed out and, with cold water and patience, for a steel one, which is what the Commission’s model assumed people would choose. For the paper straw that arrived instead, the evidence does not support it. Brussels had figures that showed paper emitting more than plastic and did not print them, Berlin compared nothing, and London found that paper adds emissions worldwide and banned plastic anyway. Whether the ban has reduced straw litter in Europe is still unmeasured five years on. The evaluation due in 2027 is the first occasion on which the EU has to check.
Sources
-
Capri-Sun, petition to the European Commission on change.org, started 28 August 2024, with the company’s update of 12 May 2026. Signature count retrieved 17 November 2026. ↩︎ ↩︎
-
Lebensmittel Praxis, “Capri-Sun - Petition für Plastikstrohhalm ist gescheitert”, 16 June 2026. ↩︎ ↩︎
-
European Parliament and Council, Directive (EU) 2019/904 on the reduction of the impact of certain plastic products on the environment, 5 June 2019. Recitals 11 and 15, Articles 5, 15(3)(c) and 17, Annex Part B. ↩︎ ↩︎ ↩︎ ↩︎
-
Einwegkunststoffverbotsverordnung, in force since 3 July 2021. § 3(1) no. 4. ↩︎
-
Nathan J. Robinson and Christine Figgener, “Plastic Straw Found Inside the Nostril of an Olive Ridley Sea Turtle”, Marine Turtle Newsletter 147, 2015. ↩︎ ↩︎
-
Sea Turtle Biologist (Christine Figgener’s channel), video of the straw being removed, YouTube, uploaded 10 August 2015. 116,850,997 views, retrieved 17 November 2026. ↩︎
-
Ocean Conservancy, International Coastal Cleanup report 2026, 2026. Totals for 1986 to 2025, p. 6. Share: own calculation. ↩︎ ↩︎
-
Department for Environment, Food and Rural Affairs, “Impact Assessment on the proposal to ban the supply of plastic drinking straws to the end user in England”, 13 May 2020. ↩︎ ↩︎ ↩︎ ↩︎ ↩︎ ↩︎
-
James and others, “Strategies to Reduce the Environmental Lifetimes of Drinking Straws in the Coastal Ocean”, ACS Sustainable Chemistry & Engineering 12(6), 2404–2411, 2024. Read in abstract and press material only. ↩︎
-
Woods Hole Oceanographic Institution, “Some Plastic Straws Degrade Quicker Than Others, New Study Shows”, press release, 30 January 2024. ↩︎
-
James, Sun, Pate, Irving and Ward, “Strategies for Designing Circular, Sustainable, and Nonpersistent Consumer Plastic Products: A Case Study of Drinking Straws”, Environmental Science & Technology 59(34), 18177–18189, 2025. Table 1 for the weights. ↩︎ ↩︎ ↩︎ ↩︎ ↩︎
-
Ahlstrom, “Paper straw solutions”, product page of a paper maker, retrieved 17 November 2026. ↩︎
-
Simon Korhonen Hoge, “Consequential Life Cycle Assessment of Banning Single Use Plastics within the EU: Straw Wars: A Consequential Saga”, master’s thesis, KTH Royal Institute of Technology, 2019. Tables 1 and 7. ↩︎ ↩︎ ↩︎
-
Gutierrez, Royals, Jameel, Venditti and Pal, “Evaluation of paper straws versus plastic straws: Development of a methodology for testing and understanding challenges for paper straws”, BioResources 14(4), 8345–8363, 2019. Tables 2 and 3. ↩︎ ↩︎ ↩︎
-
Chemisches und Veterinäruntersuchungsamt Münsterland-Emscher-Lippe, “Trinkhalme aus Papier – ein bunter Chlorpropanol-Cocktail”, from the annual report of North Rhine-Westphalia’s food laboratories for 2020. ↩︎
-
thinkstep for Tetra Pak, “LCA of plastic & paper straws for portion-sized carton packages”, report v1.4, 7 October 2019. Tables E-1 and 2-1. ↩︎ ↩︎ ↩︎ ↩︎
-
Gao and Wan, “Life cycle assessment of environmental impact of disposable drinking straws: A trade-off analysis with marine litter in the United States”, Science of The Total Environment 817, 153016, 2022. Figures per straw: own calculation from the totals in section 3. ↩︎ ↩︎ ↩︎
-
Rana, “Plasticless: A Comparative Life-Cycle, Socio-Economic, and Policy Analysis of Alternatives to Plastic Straws”, master’s thesis, Michigan Technological University, 2020. Table 3.10. ↩︎ ↩︎
-
Eleni and Boukouvalas, “Environmental and Economic Impacts of Substituting Single-Use Plastic Straws: A Life-Cycle Assessment for Greece”, Polymers 17(9), 1235, 2025. ↩︎ ↩︎
-
Zanghelini, Cherubini, Dias, Kabe and Delgado, “Comparative life cycle assessment of drinking straws in Brazil”, Journal of Cleaner Production 276, 123070, 2020. Read in abstract only; affiliations as recorded by OpenAlex. ↩︎
-
Takou, Boldrin, Astrup and Damgaard, “LCA of Single Use Plastic Products in Denmark”, Danish Environmental Protection Agency, Environmental Project No. 2104, 2019. Table 5. ↩︎ ↩︎ ↩︎
-
Takunda Y. Chitaka, “Inclusion of leakage into life cycle management of products involving plastic as a material choice”, doctoral thesis, University of Cape Town, 2020, chapter 5. The chapter appeared as Chitaka, Russo and von Blottnitz in The International Journal of Life Cycle Assessment 25(9), 1818–1832, 2020, which we read in abstract only. ↩︎ ↩︎ ↩︎
-
Herberz, Barlow and Finkbeiner, “Sustainability Assessment of a Single-Use Plastics Ban”, Sustainability 12(9), 3746, 2020. Figure A6 for the straws. ↩︎ ↩︎ ↩︎
-
Korea Herald, via Asia News Network, report on the study commissioned by South Korea’s environment ministry, 23 October 2026. ↩︎
-
Eurostat, Municipal waste by waste management operations (env_wasmun), retrieved 17 November 2026. Germany 2024: 241,000 tonnes landfilled or otherwise disposed of, of 51.4 million tonnes generated. ↩︎
-
Addamo, Laroche and Hanke, “Top Marine Beach Litter Items in Europe”, Joint Research Centre, EUR 29249 EN, 2017. Annex II and table A5; categories G35, G34-G35 and G34. ↩︎
-
Seth Borenstein, Associated Press, “Science Says: Amount of straws, plastic pollution is huge”, 20 April 2018. ↩︎
-
Jambeck and others, “Plastic waste inputs from land into the ocean”, Science 347, 768–771, 2015. Abstract. ↩︎
-
Meijer, van Emmerik, van der Ent, Schmidt and Lebreton, “More than 1000 rivers account for 80% of global riverine plastic emissions into the ocean”, Science Advances 7, 2021. ↩︎
-
Our World in Data, Share of global plastic waste emitted to the ocean, the country results of Meijer and others for 2019, retrieved 17 November 2026. ↩︎
-
Law, Starr, Siegler, Jambeck, Mallos and Leonard, “The United States’ contribution of plastic waste to land and ocean”, Science Advances 6(44), 2020. Abstract. ↩︎
-
Wilcox, Mallos, Leonard, Rodriguez and Hardesty, “Using expert elicitation to estimate the impacts of plastic pollution on marine wildlife”, Marine Policy 65, 107–114, 2016. Table 2. ↩︎
-
Christian Britschgi, Reason, “Media, Legislators, Activists Stick By Straw Stats Produced By 9-Year-Old”, 6 February 2018. ↩︎
-
Eunomia for Seas at Risk, “Leverage Points for Reducing Single-use Plastics”, background report, 2017. Section 2.4. ↩︎
-
ICF and Eunomia for the European Commission, “Assessment of measures to reduce marine litter from single use plastics”, final report and annex, May 2018. Annex, tables A2.1, A2.2, A2.7 and A2.8, and sections A2.1.9 and 4.5.3.7. ↩︎ ↩︎ ↩︎ ↩︎ ↩︎
-
Sebastian Langer, Nordkurier, “Falsche Zahlen bei Strohhalm-Debatte”, 4 May 2018. ↩︎
-
Ivan Paspaldzhiev and Jon Stenning for the European Commission, “Life Cycle Inventories of Single Use Plastic Products and their Alternatives”, dated December 2017, published July 2018. Table 3, per use, in kilograms. ↩︎
-
European Commission, impact assessment SWD(2018) 254 final, 28 May 2018. Part 1, section 6; part 3, sections 4 and 9. ↩︎ ↩︎
-
Department for Environment, Food and Rural Affairs, post-implementation review of the plastic straws, cotton buds and stirrers regulations, September 2025. Sections 2.5, 2.6 and 3. ↩︎ ↩︎ ↩︎
-
Bundesregierung, Bundestag Drucksache 19/20349, draft of the Einwegkunststoffverbotsverordnung with its official reasoning, 24 June 2020. PDF pp. 14 and 16. ↩︎
-
Deutscher Bundestag, Petitionsausschuss, Petition 125085, filed 27 July 2021, with the reasons for closing it of 7 July 2022. ↩︎
-
Umweltbundesamt, “Fragen und Antworten: Umsetzung der EU-Einwegkunststoffrichtlinie”, updated 12 August 2026. ↩︎
-
Department for Environment, Food and Rural Affairs, “One year review of the impact of the plastic straw restrictions”, September 2022. ↩︎
-
Hanke and others, report on litter trends on European coastlines, 2015 to 2021, Joint Research Centre, JRC138907, 2025. ↩︎
-
Ocean Conservancy, International Coastal Cleanup annual reports, reports of 2014 to 2026 on the cleanups of 2013 to 2025. Shares: own calculation, straws and stirrers divided by all items. ↩︎
-
Jenna Schaefer, “The effect of single-use plastic bans on coastal litter: Evidence from straw and foam container policies”, master’s thesis, University of Illinois Urbana-Champaign, 2025. Abstract only. ↩︎
-
European Commission, Rules on single-use plastics and fishing gear (evaluation), call for evidence of 23 December 2025. ↩︎
-
Öko-Test, “Papierstrohhalme im Test: Einige sind mit Schadstoffen belastet”, Öko-Test Magazin 6/2024. ↩︎ ↩︎ ↩︎
-
NPR, “Why People With Disabilities Want Bans On Plastic Straws To Be More Flexible”, 11 July 2018. ↩︎
-
The Environmental Protection (Plastic Straws, Cotton Buds and Stirrers) (England) Regulations 2020, SI 2020/971. Regulations 5 to 9. ↩︎
-
Tweede Kamer, answers of Minister Kuipers (health, welfare and sport) to written questions on paper straws, Aanhangsel 2384 and Aanhangsel 2907, session 2021–2022. ↩︎
-
Finnish Food Authority, “Supervise the use of a paper straw when feeding small children”, 16 August 2022. ↩︎
-
Boisacq and others, “Assessment of poly- and perfluoroalkyl substances (PFAS) in commercially available drinking straws using targeted and suspect screening approaches”, Food Additives & Contaminants: Part A 40(9), 1230–1241, 2023. ↩︎
-
Taylor & Francis, “Paper drinking straws may be harmful and may not be better for the environment than plastic versions, researchers warn”, press release, 24 August 2023. ↩︎
-
Timshina, Aristizabal-Henao, Da Silva and Bowden, “The last straw: Characterization of per- and polyfluoroalkyl substances in commercially-available plant-based drinking straws”, Chemosphere 277, 130238, 2021. Abstract. ↩︎
-
European Parliament and Council, Directive (EU) 2020/2184 on the quality of water intended for human consumption, 16 December 2020. Annex I, Part B: sum of PFAS, 0.10 µg/l. ↩︎
-
Bundesamt für Verbraucherschutz und Lebensmittelsicherheit, report on programme 3.3 of the nationwide monitoring plan 2020, chloropropanols from paper articles in contact with food, 17 August 2021. p. 5. ↩︎
-
Bayerisches Landesamt für Gesundheit und Lebensmittelsicherheit, “Chlorpropanole bei Lebensmittelbedarfsgegenständen aus Papier”, annual report 2021/2022, on samples of 2021. ↩︎
-
Umweltbundesamt, “Recyclingpapier ist gut für die Umwelt”, updated 20 August 2025. ↩︎
-
BBC News, “McDonald’s paper straws cannot be recycled”, 5 August 2019. ↩︎
-
Korea Herald, “S. Korea retracts bans on disposable cups at cafes, restaurants”, 7 November 2023. ↩︎
-
Korea Herald, “Korea to ban free disposable plastic cups at cafes, restaurants”, 17 December 2025. ↩︎
-
Korea Times, “Korea dangles $0.60 discount to push coffee drinkers away from plastic”, 14 July 2026. ↩︎
-
The President of the United States, Executive Order 14208 on ending the procurement and forced use of paper straws, 10 February 2025, Federal Register vol. 90, p. 9585. ↩︎
-
Domestic Policy Council, “National Strategy to End the Use of Paper Straws”, March 2025. p. 10. ↩︎