In October 2017 the Entomological Society Krefeld, on the Lower Rhine, and a group of ecologists from Nijmegen published what the society’s insect traps had caught over 27 years. The answer was less and less: by 2016 the weight of flying insects in German protected areas was 76 per cent lower than in 19891. The German language gained a word for it: Insektensterben, the dying of the insects. It was almost absent from the newspapers before 2017 and at its most frequent in 20192. In that year 1.74 million Bavarians, 18.3 per cent of the electorate and more than had ever signed a petition for a referendum there, put their names to one called Rettet die Bienen (save the bees)3. The federal cabinet adopted an action programme with an extra €100m a year4, and in 2021 parliament passed a law5.
The claim behind all this is that Germany has lost three-quarters of its insects. It can be checked, because the measurements are public. The Krefeld data can be downloaded trap by trap. The Red Lists are public too, and they are the only source that covers thousands of insect species across the whole country. So are the results of the butterfly counts that volunteers have made every summer since 2005. Together they give three answers. Where insects were weighed, the fall is real. Whether it holds for Germany, nobody has measured. Whether it is still going on, nobody can say.
Three numbers from one data set
The traps of the Entomological Society Krefeld, 1989 to 2016.
What 53.5 kilograms can show
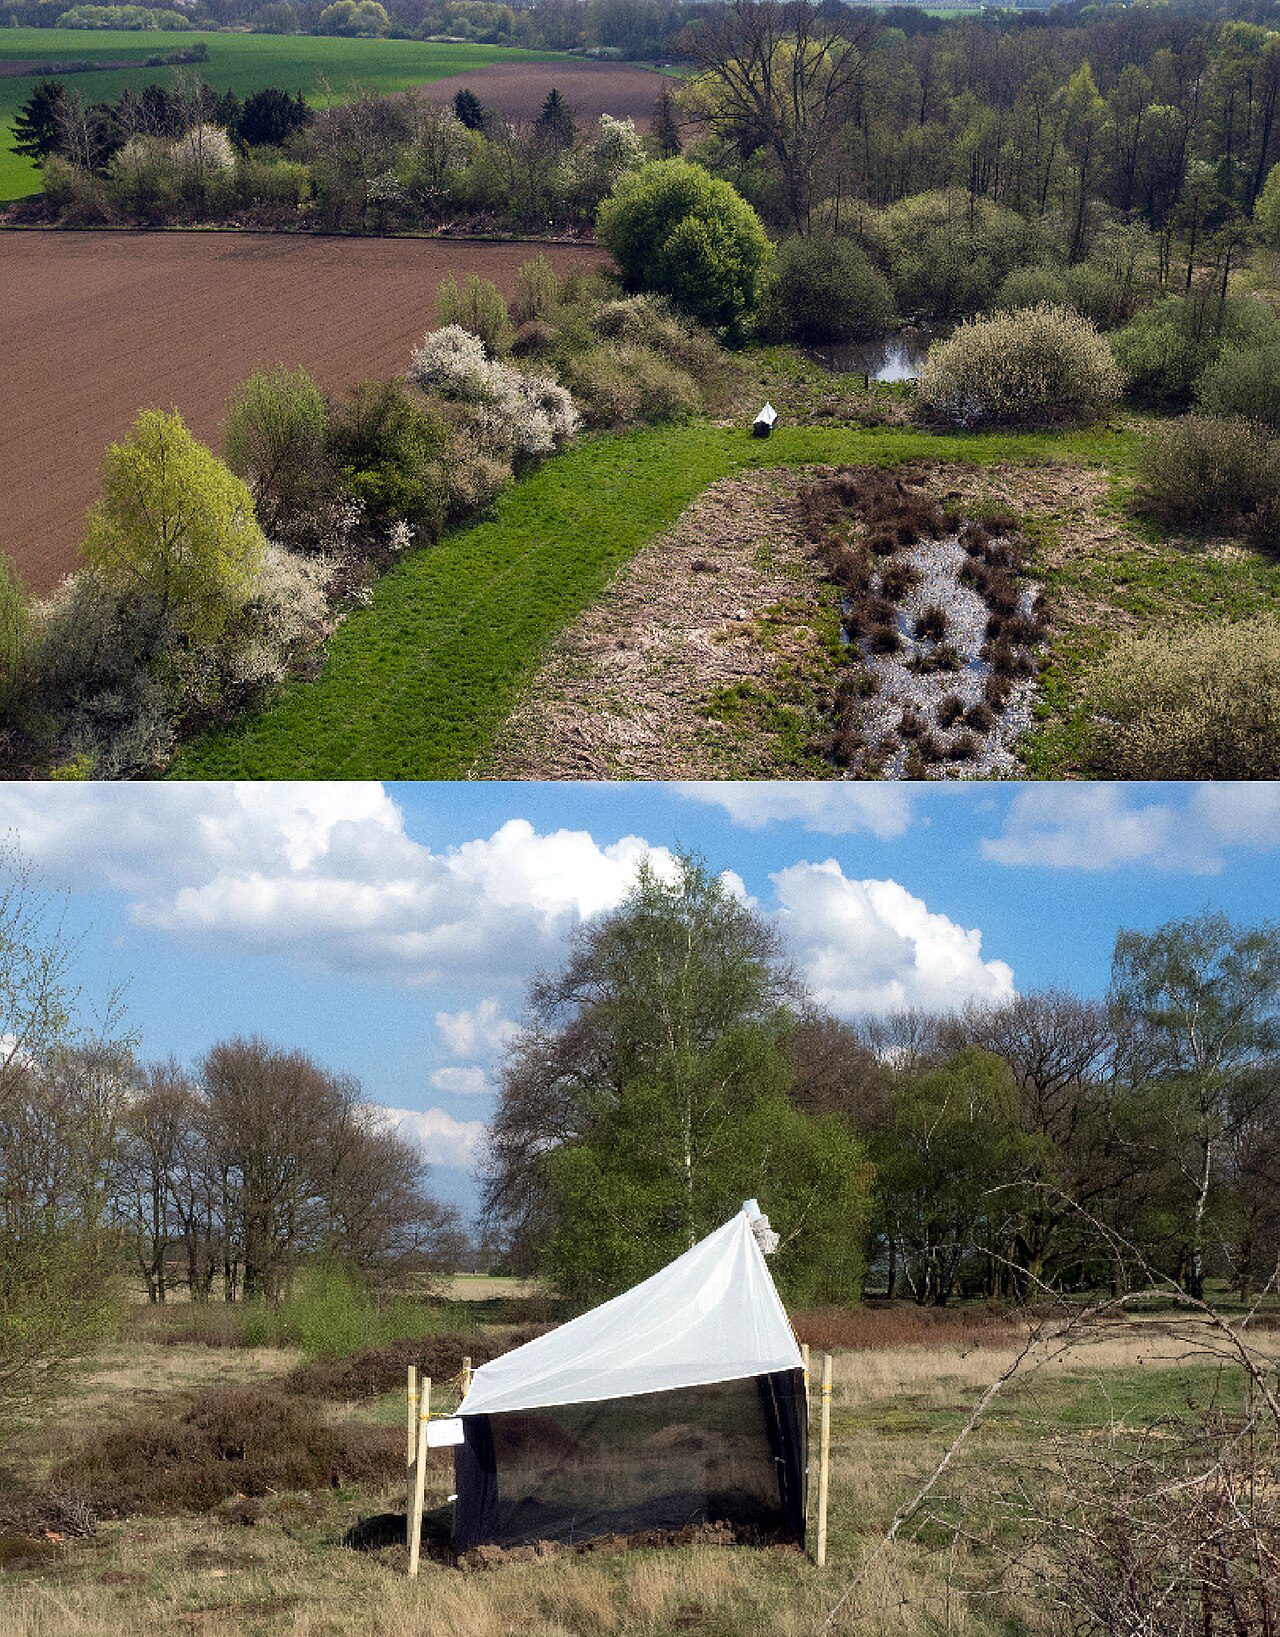
A Malaise trap is a tent of fine netting, open at the sides. Insects fly in, climb towards the light and drop into a bottle of alcohol. The Krefeld society has sewn its traps to a single pattern since 19826. Between 1989 and 2016 it set them at 63 sites and emptied the bottles from spring to autumn, on average every 11 days. Each catch was drained, weighed while still wet with alcohol and stored. For these weights nobody counted the animals or named the species. Over the whole period the traps yielded 1,503 samples and 53.54 kilograms of insects, which the authors take to be millions of individuals1.
The published result is one trend fitted to all 1,503 samples. In midsummer it is a fall of about 6 per cent a year, which comes to 82 per cent over the 27 years. Weighted over the whole season, from April to October, the fall is 76 per cent1.
The most direct evidence for it is also the simplest. In the Orbroicher Bruch, a nature reserve in Krefeld, two traps stood on the same two spots in 1989 and in 2013 and were emptied every week in both years. The first caught 1,117 grams in 1989 and 257 grams in 2013, the second 1,426 and 2947. That is a loss of 77 and 79 per cent (own calculation). By our own calculation from the published data, insect weight per trap and day was lower at the last visit than at the first at all 26 sites that were trapped in more than one year. At 15 of them the first visit and the last lie more than 20 years apart. Ten of those were trapped in those two years only, the other five in one or two years more8. The authors’ model, run on those 26 sites alone, gives a decline of 76.2 per cent1.
The most common objection does not survive a look at the data. In 2017 the Unstatistik des Monats, a column on misused statistics from the RWI economic institute in Essen, pointed out that any decline depends on its starting year, and claimed that from 1991 instead of 1989 the fall would have been about 30 per cent9. The year 1991 in the data is one trap with ten samples (own count)8. The 76 per cent is a trend through all the years and does not hang on any one of them. When the authors fitted it again without 1989 and 1990, they got 76.8 per cent10. The raw averages point the same way: 8.5 grams per trap and day in 1989, 5.3 in 1990 to 1994, and 1.6 in 2012 to 2016. Measured from the early 1990s the raw fall is 69 per cent instead of 81 (own calculation)8.
A count made from the same stored samples agrees. In the Wahnbachtal, a reservoir valley in North Rhine-Westphalia, six traps stood on the same spots in 1989 and 2014, and the hoverflies from both years were sorted and named: 16,966 individuals of 141 species in 1989, 2,638 individuals of 102 species in 201411.
The Krefeld series, and how many sites stand behind it
Above: average weight of insects per trap and day in each year. Below: the number of sites trapped in that year. Three years have no data.
Show the numbers
| Year | Sites | Samples | Grams per trap and day | Days per sample (mean) |
|---|---|---|---|---|
| 1989 | 8 | 162 | 8.5 | 7.0 |
| 1990 | 2 | 62 | 5.3 | 7.3 |
| 1991 | 1 | 10 | 3.2 | 14.6 |
| 1992 | 4 | 54 | 5.3 | 8.3 |
| 1993 | 4 | 39 | 5.1 | 11.2 |
| 1994 | 4 | 60 | 6.0 | 11.4 |
| 1995 | 2 | 41 | 4.6 | 7.0 |
| 1996 | 0 | 0 | – | – |
| 1997 | 1 | 20 | 3.7 | 8.1 |
| 1998 | 0 | 0 | – | – |
| 1999 | 2 | 56 | 6.3 | 7.0 |
| 2000 | 2 | 47 | 4.6 | 7.4 |
| 2001 | 3 | 81 | 2.5 | 7.0 |
| 2002 | 0 | 0 | – | – |
| 2003 | 3 | 80 | 5.6 | 7.5 |
| 2004 | 2 | 48 | 4.9 | 8.3 |
| 2005 | 4 | 70 | 2.9 | 10.8 |
| 2006 | 2 | 26 | 4.1 | 14.5 |
| 2007 | 2 | 15 | 1.8 | 20.9 |
| 2008 | 2 | 24 | 1.9 | 13.5 |
| 2009 | 4 | 23 | 1.7 | 18.8 |
| 2010 | 2 | 12 | 1.3 | 14.2 |
| 2011 | 1 | 4 | 4.4 | 17.0 |
| 2012 | 2 | 23 | 2.3 | 13.8 |
| 2013 | 8 | 126 | 1.7 | 11.1 |
| 2014 | 23 | 348 | 1.4 | 14.1 |
| 2015 | 1 | 10 | 1.8 | 22.4 |
| 2016 | 7 | 62 | 2.2 | 21.5 |
What 63 sites cannot show
The same data show how thin the series is. No site was trapped in every year. Thirty-seven of the 63 were trapped in one year only, 20 in two, five in three and one in four1. The 1989 figure comes from eight traps in two places, the Orbroicher Bruch and the Wahnbachtal. The year 1990 has two sites and 1991 one; 1996, 1998 and 2002 have none. One year, 2014, supplies 23 sites and 348 of the 1,503 samples (own count)8. The authors say it themselves: “Our data do not represent longitudinal records at single sites”1.
Most of the return visits came late. Of 33 repeat visits, 29 fell in the years 2013 to 2016 (own count)8. The authors explained why in a note they posted a month after the paper: “When over the years declines became conspicuous, locations were increasingly resampled”10. Going back to the places where a fall has been noticed confirms the fall there. It is a poor way of finding out how general the fall is. A review of the field in 2020 named the habit as the first of seven pitfalls: most studies of decline, it observed, begin only “after numbers were perceived to be changing”12.
The emptying of the traps changed along the way, and the 2017 paper does not discuss it. In most years up to 2004 the bottles were emptied about once a week. From 2006 they mostly stayed out for two weeks or more. The average sample covers 8.0 days in the years up to 2004 and 14.7 days from 2006 (own calculation)8. The series drops to a lower level at about the same time. A later paper by the same authors gives the figures for the six Wahnbachtal traps: 7.0 days in 1989 and 16.7 in 201411. The statistical model allows for the number of days each bottle was out, and before weighing the society brought the alcohol in every sample to the same strength1. Whether a catch that has stood twice as long in the bottle weighs the same once drained is a different question, and we found no published test of it. The handbook for the planned national monitoring scheme tells trappers not to stretch the interval beyond 14 days, so that the data stay comparable13. The Orbroich traps suggest the change cannot explain much: they were emptied weekly in 1989 and in 2013 and lost almost four-fifths of their catch all the same.
Fifty-seven of the 63 sites are in North Rhine-Westphalia, five in Brandenburg and one in Rhineland-Palatinate. All lie in protected areas and in the lowlands, and 94 per cent are surrounded by farmland1. They were not drawn at random. The society’s work, the paper says, is “spread over numerous individual projects at different locations and in different years”1. The authors claim only that their decline is “representative for lowland protected areas in west Germany”1, a statement about protected areas in one part of the country.
No site was trapped in every year.
— The Krefeld data
Weight, the number of animals and the number of species are three different measures. In a study that weighed Malaise-trap samples and then counted the 533,128 insects in them, weight and number mostly went together14. Weight and the number of species need not. In 2019 researchers set 179 Malaise traps across Bavaria, in forests, meadows, fields and towns. Insect weight was 42 per cent lower in towns than in semi-natural landscapes and no lower in farmland, while the number of species was 29 per cent lower in farmland. The contrast, the authors wrote, calls into “question the use of these indicators as mutual surrogates”15. On the Lüneburg Heath eight pitfall traps ran from 1994 to 2017; the weight and number of ground beetles in them did not fall, the number of species did16.
On the cause the Krefeld paper is more modest than its reputation. In the authors’ model, weather, the land use around the sites and the plants growing on them explained none of the fall. With those factors alone, the model says, insect weight would have stayed level or risen by about 8 per cent. Intensive farming is something the authors “could not incorporate” for lack of data, and they write that it “may form a plausible cause”1. They present it as a suspicion. Asked in 2023 what share of the lost weight is due to agriculture, the federal government answered that it had no findings on the matter17.
From two traps to a law
The number reached politics before the study did. In January 2016 the Bundestag’s environment committee heard a representative of the conservation group NABU present the society’s weights, most of which were then unpublished. The summary the committee heard: “Die Insektenbiomasse, die in unserer Landschaft fliegt, ist weg” (the insect biomass that flies in our landscape is gone)18. In July 2017, three months before the paper appeared, the federal government told parliament: “Studien zufolge gibt es an Versuchsstandorten dramatische Rückgänge der Insektenbiomasse vom Jahr 1982 bis zum Jahr 2017 um bis zu 80 Prozent”19. That is: according to studies there are dramatic falls in insect biomass at trial sites, of up to 80 per cent from 1982 to 2017. No published data set covers those years. The first study the answer lists is the comparison of two traps in the Orbroicher Bruch. The Greens’ election manifesto of that summer, as the RWI column quoted it, said the number of flying insects had fallen by 80 per cent in recent years20.
The same government answer contains a sentence that has lasted better: “Eine belastbare, bundesweit repräsentative Datenbasis zur Einschätzung von Langzeitveränderungen von Vorkommen und Bestandsgrößen der Insektenfauna in Deutschland gibt es nicht”19. In English: there are no reliable, nationally representative data for judging long-term change in where Germany’s insects occur and how many there are. Two years later the cabinet’s action programme called the Insektensterben “eine bundesweite und klar belegbare Entwicklung” (a nationwide and clearly demonstrable development), one that the Red Lists had proved scientifically4.
The Red Lists: a long loss and a large blank
Germany has more than 33,300 known insect species4. The Red Lists, which the Federal Agency for Nature Conservation publishes group by group, have assessed 13,984 of them17. That is 42 per cent (own calculation). For the rest there is no assessment at all, and how many of them are threatened cannot, the government wrote in 2017, “seriös hochgerechnet werden” (be reliably extrapolated) from the lists19. Of the species assessed, 571 are classed as extinct or lost (ausgestorben oder verschollen) and a further 4,159 as threatened17.
In 2019 the government added up the trends that the lists give for 6,921 of these species, those in the volumes of 2011 and 201621. Over the long term, meaning the last 50 to 150 years, 45 per cent have declined, 40 per cent are unchanged and 2 per cent have increased; for 13 per cent the trend is not known. Over the short term, the last 10 to 25 years, 23 per cent have declined, 44 per cent are unchanged and 4 per cent have increased. For 30 per cent the experts could not say.
What the Red Lists say about 6,921 insect species
Trend of each species over the long term and over the short term, as the federal government added them up in 2019. The lists are expert assessments, not counts.
Show the numbers
| Trend | Long term (50 to 150 years) | Short term (10 to 25 years) |
|---|---|---|
| Declining | 3,086 (45%) | 1,559 (23%) |
| Unchanged | 2,762 (40%) | 3,011 (44%) |
| Not known | 923 (13%) | 2,083 (30%) |
| Rising | 150 (2%) | 268 (4%) |
The loss is real and lopsided: species in decline outnumber species on the rise by twenty to one over the long term and by almost six to one over the short (own calculation). But the figure usually quoted, nearly half of all species in decline, describes the last 50 to 150 years, and much of that time had passed before anyone in Krefeld set a trap. For the years the Insektensterben is about, the lists report decline for almost a quarter of the species and no knowledge for almost a third.
The lists do not rest on counts. Their method paper says it works with classes instead of numbers “weil nur für wenige Arten Zählungen oder präzise Schätzungen vorliegen” (because counts or precise estimates exist for only a few species)22. The authors of the bee list drew on collections, on letters and conversations and on their own field experience, and they also treated a decline as shown where a species’ preferred habitat had clearly shrunk23. This is the judgement of the people who know the animals best, and it is the best national evidence there is. It does not measure how many insects there are.
The three lists published since 2024 do not agree. Of 207 butterflies and burnet moths (species and subspecies) assessed in 2025, 109 have declined over the short term and 15 have increased24. Of 83 robber flies, 24 have declined and three have increased (own count from the list’s table)25. Of 83 grasshoppers, crickets and their relatives, 30 have declined and 21 have increased26.
The one long national count
Only one group of insects has been counted across Germany by a fixed method for long enough to show a trend. Since 2005 the volunteers of the Tagfalter-Monitoring Deutschland have walked set routes through the summer and counted the butterflies section by section: more than four million butterflies on 1,620 routes so far27.
In 2005 they counted 41 butterflies per section. In 2023, the latest year evaluated, they counted 40. In between lies a hump, with 81 in 2009 and between 55 and 74 in most years up to 201827. The scheme’s own report calls 2023 its worst year so far and adds that, per section, it was almost identical to the first27. The first year is a weak yardstick, though: the scheme began with 180 routes, had 300 a year later, and computes its own trends from 2006. Measured from 2006, when the count was 53 per section, 2023 is a quarter lower (own calculation)27. For 2024 there are no figures yet; the report’s editors write that many volunteers told them there had never been so few butterflies27.
Butterflies per section, 2005 to 2023
Average number of butterflies counted per 50-metre section of route in the Tagfalter-Monitoring Deutschland. The first year and the latest one, the two contrasting columns, are almost equal; the scheme started small and computes its own trends from 2006.
Show the numbers
| Year | Butterflies per section |
|---|---|
| 2005 | 41 |
| 2006 | 53 |
| 2007 | 57 |
| 2008 | 51 |
| 2009 | 81 |
| 2010 | 68 |
| 2011 | 74 |
| 2012 | 55 |
| 2013 | 62 |
| 2014 | 67 |
| 2015 | 46 |
| 2016 | 58 |
| 2017 | 60 |
| 2018 | 68 |
| 2019 | 47 |
| 2020 | 52 |
| 2021 | 52 |
| 2022 | 49 |
| 2023 | 40 |
Species by species the balance is negative. Of 82 species with enough data, 36 declined between 2006 and 2023, 18 increased, 23 were stable and five uncertain. A year earlier the report had counted 28 decliners, so one bad summer moved eight species across the line27. The German grassland butterfly index, built from the same counts, falls by about 0.7 per cent a year over 2006 to 2023 by either of two accepted methods, though only one of them finds the fall statistically significant. Over the last ten years both show a fall of about 3 per cent a year28.
The count has limits of its own. The volunteers choose their routes, the set of routes changes from year to year, and the authors of the 2025 Red List call many of the scheme’s trends “nur eingeschränkt repräsentativ” (only partly representative) because of gaps in its coverage24. It is still the nearest thing Germany has to a national insect series. It shows a rise to 2009 and a fall over the last ten years, to the lowest value so far.
The second study, and its first year
The Krefeld result seemed to be confirmed in 2019. A team led from the Technical University of Munich had swept 150 grassland plots with nets every year from 2008 to 2017 and run flight traps on 30 forest plots from 2008 to 2016, in three regions of Germany. In the grasslands the estimated weight of insects and spiders fell by 67 per cent, their number by 78 per cent and the number of species by 34 per cent. In the forests weight fell by 41 per cent and species by 36 per cent29. Nothing was put on a scale: weight was calculated from the body length of the animals29.
The paper’s own supplement shows how much depends on the method. The 67 per cent is the fall implied by a model through all ten years. Setting the first year against the last gives 50 per cent, and setting the first two years against the last two gives 36. For the forests the three figures are 41, 27 and 1030. The supplement also says when the fall happened. Most of it, particularly in grasslands, came between 2008 and 2010, which in the authors’ words “raises the concern whether 2008 is a reliable starting point”30. In 2009 the people doing the netting changed in all three regions, and the authors “cannot rule out that changes of observers might have contributed somehow to differences between 2008 and 2009”30.
One study, three sizes of decline
Change in insects and spiders on 150 grassland plots (2008 to 2017) and 30 forest plots (2008 to 2016), computed three ways by the study’s own authors. The top bar of each group is the figure in the paper’s abstract.
Show the numbers
| Measure | Model through all years | First year against last | First two years against last two |
|---|---|---|---|
| Grassland: weight | −67% | −50% | −36% |
| Forest: weight | −41% | −27% | −10% |
| Grassland: number of species | −34% | −27% | −16% |
| Forest: number of species | −36% | −32% | −21% |
A re-analysis published in 2021 allowed for the fact that plots sampled in the same year share the same weather. By its authors’ account four of the five reported declines were then no longer statistically significant, although the estimated declines remained “substantial, yet with much higher uncertainty”31. The original team replied that the high numbers of 2008 “contributed to the overall decline in grasslands but are not solely responsible for it”32.
What went up
A general dying of insects should leave few winners. There are many. In records from 1980 to 2016, 35 of Germany’s 77 dragonfly species spread to more map squares, 22 retreated and 20 showed no clear change33. In Bavaria between 1980 and 2019, 37 per cent of butterfly, grasshopper and dragonfly species lost ground and 30 per cent gained it. The gainers were mostly species that like warmth, the losers species that need cold34. Across Europe the abundance of invertebrates in monitored rivers and streams rose by 1.17 per cent a year between 1968 and 2020, which the authors put down to cleaner water and restored rivers; the rise has levelled off since the 2010s35. Ground beetles at 40 sites in five German regions showed no overall change in diversity over two decades, though the authors add that the damage may have been done before their series began in 199936.
None of this cancels the losses. The diversity of dragonflies rose until 2010 and fell from then to the end of the records in 201633. In one small stream in Hesse, sampled for 42 years, the number of insects hatching fell by 81.6 per cent while the number of species rose37. But there is no single trend for insects as such. The German research community’s own stock-take of 2024, the Faktencheck Artenvielfalt, concluded that none of the well-known studies can give an overall picture of the change in Germany, and that their representativeness for the country is still unclear38.
The most familiar insect is not dying out. The number of honeybee colonies in Germany fell from 1.2 million in 1991 to 670,000 in 2007 and has since risen again to about 1 million39. The honeybee is livestock, kept and fed by people, and says little about wild insects. Of 557 wild bee species assessed, 228 are threatened23. But it was bees that the Bavarian petition promised to save, and it was Bienensterben, the dying of the bees, that the Society for the German Language ranked among its words of the year in 201940.
Since 2016: two camps and no series
The Krefeld series ends in 2016. What has happened since is disputed, and the dispute shows how little there is to go on.
In 2023 a team led by the ecologist Jörg Müller re-analysed the Krefeld data in Nature. It reported that weather, during trapping and in the seasons before, explained the variation in insect weight including the decline, and it added catches from Bavaria up to 2022, which were high41. In the file the team published, the average Bavarian catch rises from 2.1 grams per trap and day in 2016 to 9.1 in 2022, above the 8.5 of Krefeld’s 1989 (own calculation; the file multiplies the Bavarian catches by 1.39 to allow for a different trap)42.
Two replies followed. One showed that when a plain yearly trend is added to the weather model, a decline of 4 per cent a year remains that weather does not explain43. The other came from the Krefeld authors. They called the joining of the two data sets “unwarranted and misleading”, because the Bavarian traps were of another type and stood in another region, in 2022 mostly in clearings cut into forest. In new catches from North Rhine-Westphalia and from 21 protected areas across Germany they found “no biomass recovery”44.
Neither side can show a trend. The 21 protected areas were trapped in 2020 and 2021 only. Their catches, between 0.95 and 3.62 grams per trap and day, are at the low level of Krefeld’s last decade, and their authors grant that two years show no trend45. For North Rhine-Westphalia the one published figure is an average of 1.8 grams per trap and day, from a state programme at 101 sites that began in 201746. The data behind the Krefeld authors’ reply have been deposited but not opened: on 6 October 2026 the files were marked restricted47. Müller’s team reported in turn that the median catch at its Bavarian sites fell from about 9 grams to 4 in 2023, and wrote that “neither our nor their new data from after 2016 are sufficient to test for trend changes”48.
On two points the two sides agree. Weather moves the catch from year to year, and the Krefeld data are not a balanced series from fixed sites4448. Müller’s team adds that no conclusions about causes can be drawn from observational data of this kind48. Christoph Scherber, an ecologist who heads a centre for biodiversity monitoring in Bonn, told the magazine Spektrum in 2025: “Wir sind immer noch bei Stufe null vom Insekten-Monitoring in Deutschland” (we are still at stage zero of insect monitoring in Germany)49.
Neither side can show a trend.
— After 2016
The national scheme that has no results yet
The environment ministers of the federal states asked for a national insect monitoring scheme in November 2017, a month after the Krefeld paper. Work on the concept began in 2018. The design is ambitious: 1,000 sample squares of one square kilometre each, spread over the whole country, with counts of butterflies, grasshoppers, ground beetles and wild bees, and with Malaise traps, on all or some of them13.
Eight years after work began, the federal government’s National Monitoring Centre for Biodiversity gives the scheme’s running time as “In Entwicklung” (in development)50. In July 2025 the agreement between the federal government and the states that is meant to carry it was still being settled51. According to the centre, federal co-financing starts in 2026 and for now covers butterflies and grasshoppers52. The Federal Agency for Nature Conservation’s own page still says that nationally representative data on long-term change in the insect fauna are lacking53.
Pieces exist. Several states have started modules of their own. A research network has run Malaise traps at more than 80 sites since 201954. The one multi-year result we could find from it covers 14 traps in three areas of Hesse from 2019 to 2022: 3.3 grams per trap and day on average, and no clear trend in weight or in the number of species55.
The environment ministry’s public information, last revised in August 2026, is surer of itself. The extent of the decline, it says, is “dramatisch und hinreichend wissenschaftlich belegt” (dramatic and sufficiently proven by science), and falls of around 80 per cent in the number of animals are no exception5.
Evidence from abroad that has changed
Much of what the German debate borrows from other countries has changed since it was first borrowed.
The warning that insects could vanish within a century does not come from a study. The literature review it is credited to says something starker: unless farming changes, “insects as a whole will go down the path of extinction in a few decades”56. The century comes from a newspaper interview of 2019, in which the review’s first author said that at a loss of 2.5 per cent a year “in 100 years you will have none”57. (Compounded, a loss of 2.5 per cent a year leaves 8 per cent after a century; own calculation.) The review had searched the literature with the terms insect, survey and decline. Three Finnish ecologists answered: “If you search for declines, you find declines”58.
A widely cited windscreen count, a Danish study of insects killed on a car windscreen between 1997 and 2017, was retracted in June 2026 after large duplications were found in its data; the editors consider its results invalid59. A large meta-analysis of 2020 puts the loss of land insects worldwide at 1.1 per cent a year and Germany’s at 2.1 per cent, the latter from six data sets of which Krefeld is one60. Since January 2026 it has carried an editorial expression of concern in Science61. Two French researchers had listed 553 problems in its database. They argue that the problems more often favour increases than decreases, so that the database understates the decline, and that as it stands it permits no estimate of the trend at all62. A follow-up by the meta-analysis’s authors in 2024, with newer data, put the loss at 1.5 per cent a year63. And the standard example of insects that rose before they fell, 50 years of British moths, was corrected in 2021. Software errors had corrupted a quarter of the series. The corrected one shows no difference between its first decade and its last, and over the whole period a falling trend where the original had a rising one64.
The corrections run in both directions, which is a reason to trust measurements with open data over summaries of them, whichever way the summaries point.
The verdict
Claim: by weight, the traps catch three-quarters fewer flying insects. True of the catches at 63 lowland sites in protected areas, most of them in North Rhine-Westphalia, between 1989 and 2016. The result does not hang on the starting year, and every site that was visited more than once had lost weight. The series is thin, the bottles stood longer in the later years, and no continuous series from a fixed set of sites across the country has been published since.
Claim: Germany has lost three-quarters of its insects. Not measured. The figure is for protected areas, mostly in one state, and for grams. The government said so itself in July 2017, in the same answer that cited a fall of up to 80 per cent: no nationally representative data existed.
Claim: insect species are in decline. Over the last 50 to 150 years, yes: 45 per cent of 6,921 species have declined and 2 per cent have increased. Over the last 10 to 25 years almost a quarter have declined and for almost a third nobody knows, while some groups are gaining. Nearly six in ten of the country’s insect species have never been assessed.
Claim: the dying continues. Unknown. The butterfly counts have fallen over the last ten years, and 2023 was the lowest year so far. The trap data after 2016 are short, disputed and in part not public.
Claim: farming is the cause. Not shown. The Krefeld study could not test it and does not claim it. In Bavaria insect weight was no lower in farmland than in semi-natural landscapes, though the number of species was.
The evidence that started all this holds up better than its critics allow and covers far less than its users say. A country wrote a programme and a law largely on the strength of 53.5 kilograms of insects from 63 sites. Nine years after the paper it still cannot say whether it is losing insects, because the count that would tell it is only now beginning. At 63 sites the insects have been weighed. Across the country, apart from the butterflies, they have yet to be counted.
Sources
-
Caspar A. Hallmann, Martin Sorg, Eelke Jongejans and nine others, “More than 75 percent decline over 27 years in total flying insect biomass in protected areas”, PLOS ONE 12(10): e0185809, 18 October 2017. ↩︎ ↩︎ ↩︎ ↩︎ ↩︎ ↩︎ ↩︎ ↩︎ ↩︎ ↩︎ ↩︎
-
Digitales Wörterbuch der deutschen Sprache, entry “Insektensterben”, word-frequency curve for the newspaper corpus, read off the published chart, retrieved 6 October 2026. ↩︎
-
Bayerisches Landesamt für Statistik, Volksbegehren in Bayern seit 1946, table of all petitions for a referendum since 1946. No. 21, “Rettet die Bienen!”, 31 January to 13 February 2019: 1,741,017 valid entries, 18.3 per cent. The comparison with the earlier petitions is our own, from the same table. ↩︎
-
Bundesregierung, Aktionsprogramm Insektenschutz der Bundesregierung, cabinet version, 4 September 2019. ↩︎ ↩︎ ↩︎
-
Bundesumweltministerium, questions and answers on insect protection, as of 5 August 2026. The law is the Gesetz zum Schutz der Insektenvielfalt in Deutschland of 18 August 2021, Bundesgesetzblatt I p. 3908. ↩︎ ↩︎
-
Hallmann et al., S2 Appendix, “Malaise traps”, supporting information to the 2017 paper. ↩︎
-
Martin Sorg, Heinz Schwan, Werner Stenmans and Andreas Müller, “Ermittlung der Biomassen flugaktiver Insekten im Naturschutzgebiet Orbroicher Bruch mit Malaise Fallen in den Jahren 1989 und 2013”, Mitteilungen aus dem Entomologischen Verein Krefeld 1 (2013): 1–5, archived copy. ↩︎
-
Hallmann et al., S1 Dataset, supporting information to the 2017 paper: one row per trap sample, with site, year, first and last day and weight. All figures marked as own calculation or own count in the Krefeld sections come from this file; days are counted from the first to the last day of each sample, both included. ↩︎ ↩︎ ↩︎ ↩︎ ↩︎ ↩︎
-
RWI – Leibniz-Institut für Wirtschaftsforschung, “Insektensterben die zweite”, Unstatistik des Monats, 27 October 2017. ↩︎
-
Caspar Hallmann, Martin Sorg, Eelke Jongejans, Henk Siepel and Hans de Kroon, authors’ comment on the raw data and the estimated trend, posted with the paper at PLOS ONE, 14 November 2017. ↩︎ ↩︎
-
Caspar A. Hallmann, Axel Ssymank, Martin Sorg, Hans de Kroon and Eelke Jongejans, “Insect biomass decline scaled to species diversity: General patterns derived from a hoverfly community”, Proceedings of the National Academy of Sciences 118(2): e2002554117, 11 January 2021. Table 1 and the methods. ↩︎ ↩︎
-
Raphael K. Didham and twelve others, “Interpreting insect declines: seven challenges and a way forward”, Insect Conservation and Diversity 13(2): 103–114, March 2020. ↩︎
-
Hella Ludwig and six others, Bundesweites Insektenmonitoring (IM): Methodenhandbuch (Stand 2025), BfN-Schriften 749, Bundesamt für Naturschutz, 2025. ↩︎ ↩︎
-
Nicole Remmel, Julian Enss, Peter Haase and James S. Sinclair, “Are Findings of Key Insect Metrics Generalizable Across Different Taxa in Malaise Trap Samples?”, Ecology and Evolution 15(8): e72006, August 2025. Abstract. ↩︎
-
Johannes Uhler and 22 others, “Relationship of insect biomass and richness with land use along a climate gradient”, Nature Communications 12: 5946, 12 October 2021. ↩︎
-
Katharina Homburg and seven others, “Where have all the beetles gone? Long-term study reveals carabid species decline in a nature reserve in Northern Germany”, Insect Conservation and Diversity 12(4): 268–277, 2019. ↩︎
-
Deutscher Bundestag, Drucksache 20/9330, answer of the federal government to the minor interpellation “Möglicher Insektenrückgang in der Agrarlandschaft”, 15 November 2023. ↩︎ ↩︎ ↩︎
-
Deutscher Bundestag, Ausschuss für Umwelt, Naturschutz, Bau und Reaktorsicherheit, Wortprotokoll der 73. Sitzung, public hearing on the causes and effects of the loss of insect biodiversity, 13 January 2016, Protokoll-Nr. 18/73. The speaker is Josef Tumbrinck of NABU North Rhine-Westphalia, p. 4. ↩︎
-
Deutscher Bundestag, Drucksache 18/13142, answer of the federal government to the minor interpellation “Insekten in Deutschland und Auswirkungen ihres Rückgangs”, 18 July 2017. ↩︎ ↩︎ ↩︎
-
RWI – Leibniz-Institut für Wirtschaftsforschung, “80 Prozent der Insekten sind verschwunden”, Unstatistik des Monats, 31 August 2017. ↩︎
-
Deutscher Bundestag, Drucksache 19/9795, answer of the federal government to the minor interpellation “Insektensterben und Maßnahmen zum Erhalt der Biodiversität”, 30 April 2019. Answers to questions 1 and 2, on the Red List volumes of 2011 and 2016. ↩︎
-
Gerhard Ludwig, Heiko Haupt, Horst Gruttke and Margret Binot-Hafke, “Methodik der Gefährdungsanalyse für Rote Listen”, Naturschutz und Biologische Vielfalt 70(1): 23–71, 2009. ↩︎
-
Paul Westrich and six others, “Rote Liste und Gesamtartenliste der Bienen (Hymenoptera, Apidae) Deutschlands”, 5th version, February 2011, Naturschutz und Biologische Vielfalt 70(3): 373–416. Table 2 and the section on data. The list is in the Red List Centre’s download. ↩︎ ↩︎
-
Martin Musche and others, Rote Liste und Gesamtartenliste der Tagfalter und Widderchen Deutschlands, Naturschutz und Biologische Vielfalt 170(11), 2025, section 4.2.3 and section 2. Summarised in Bundesamt für Naturschutz, “Rote Liste: Tagfalter zunehmend gefährdet”, 11 December 2025. ↩︎ ↩︎
-
Bundesamt für Naturschutz, “Rote Liste: Für Raubfliegen-Arten feucht-kühler Lebensräume wird es schwerer”, 3 December 2025. The trend counts are from the list’s data table on the Red List Centre’s download page. ↩︎
-
Dominik Poniatowski and others, Rote Liste und Gesamtartenliste der Heuschrecken und Fangschrecken Deutschlands, Naturschutz und Biologische Vielfalt 170(7), 2024, table of criteria. Summarised in Bundesamt für Naturschutz, “Rote Liste: Rund ein Drittel der Heuschrecken bestandsgefährdet”, 16 May 2024. ↩︎
-
Elisabeth Kühn, Martin Musche, Alexander Harpke, Reinart Feldmann, Martin Wiemers and Josef Settele, “Tagfalter-Monitoring Deutschland: Auswertung 2005–2023”, Oedippus 42: 6–45, 2025, and the editorial of the same issue. Figure 8 for butterflies per section; the 2009 value leaves out that year’s mass arrival of painted lady butterflies. ↩︎ ↩︎ ↩︎ ↩︎ ↩︎ ↩︎
-
Alexander Harpke, Elisabeth Kühn, Thomas Schmitt, Josef Settele and Martin Musche, “The Grassland Butterfly Index for Germany”, Nature Conservation 59: 315–334, 23 September 2025. ↩︎
-
Sebastian Seibold and 18 others, “Arthropod decline in grasslands and forests is associated with landscape-level drivers”, Nature 574: 671–674, 30 October 2019. ↩︎ ↩︎
-
Seibold et al., Supplementary Information to the 2019 paper, section 3 and table S3-1. ↩︎ ↩︎ ↩︎
-
Gergana N. Daskalova, Albert B. Phillimore and Isla H. Myers-Smith, “Accounting for year effects and sampling error in temporal analyses of invertebrate population and biodiversity change: a comment on Seibold et al. 2019”, Insect Conservation and Diversity 14(1): 149–154, January 2021. ↩︎
-
Sebastian Seibold and 14 others, “Insights from regional and short-term biodiversity monitoring datasets are valuable: a reply to Daskalova et al. 2021”, Insect Conservation and Diversity 14(1): 144–148, January 2021. ↩︎
-
Diana E. Bowler and 18 others, “Winners and losers over 35 years of dragonfly and damselfly distributional change in Germany”, Diversity and Distributions 27(8): 1353–1366, 2021. ↩︎ ↩︎
-
Eva Katharina Engelhardt and 13 others, “Consistent signals of a warming climate in occupancy changes of three insect taxa over 40 years in central Europe”, Global Change Biology 28(13): 3998–4012, 2022. ↩︎
-
Peter Haase and 95 others, “The recovery of European freshwater biodiversity has come to a halt”, Nature 620: 582–588, 2023. ↩︎
-
Petr Zajicek and five others, “Long-term data reveal unimodal responses of ground beetle abundance to precipitation and land use but no changes in taxonomic and functional diversity”, Scientific Reports 11: 17468, 1 September 2021. ↩︎
-
Viktor Baranov, Jonas Jourdan, Francesca Pilotto, Rüdiger Wagner and Peter Haase, “Complex and nonlinear climate-driven changes in freshwater insect communities over 42 years”, Conservation Biology 34(5): 1241–1251, 2020. ↩︎
-
Christian Wirth, Helge Bruelheide, Nina Farwig, Jori Maylin Marx and Josef Settele (eds), Faktencheck Artenvielfalt, oekom Verlag, Munich, 2024, pp. 58–59. ↩︎
-
Food and Agriculture Organization, FAOSTAT, crops and livestock products, Germany, bees, stocks: 1,215,000 colonies in 1991, 669,999 in 2007 and 1,013,000 in 2024. Bulk file dated 23 December 2025, retrieved 6 October 2026. The agriculture ministry’s supply balance for honey gives about 976,400 colonies for 2025. ↩︎
-
Gesellschaft für deutsche Sprache, “GfdS wählt »Respektrente« zum Wort des Jahres 2019”, 29 November 2019. “Bienensterben” is eighth on the list. ↩︎
-
Jörg Müller and nine others, “Weather explains the decline and rise of insect biomass over 34 years”, Nature 628: 349–354, published online 27 September 2023. Abstract. ↩︎
-
Müller et al., data and R code to the 2023 paper, figshare, 29 September 2023. ↩︎
-
François Duchenne and Colin Fontaine, “Weather explains inter-annual variability, but not the temporal decline, in insect biomass”, Insect Conservation and Diversity 17(6): 932–937, 2024. ↩︎
-
Caspar A. Hallmann and seven others, “Weather anomalies cannot explain insect decline”, Nature 639: E7–E11, 12 March 2025. ↩︎ ↩︎
-
Roland Mühlethaler, Sebastian Köthe, Thomas Hörren, Martin Sorg, Lisa Eichler and Gerlind U. C. Lehmann, “No recovery in the biomass of flying insects over the last decade in German nature protected areas”, Ecology and Evolution 14(3): e11182, March 2024. ↩︎
-
Thomas Hörren and 13 others, “Monitoring der Biodiversität flugaktiver Insekten in NRW”, Natur in NRW 3/2023: 17–21, archived copy. ↩︎
-
Zenodo, record 14258659, data accompanying “Weather anomalies cannot explain insect decline”, dated 2 December 2024, retrieved 6 October 2026. ↩︎
-
Jörg Müller and nine others, “Reply to: Weather anomalies cannot explain insect decline”, Nature 639: E12–E13, 12 March 2025. ↩︎ ↩︎ ↩︎
-
Joachim Budde, “Insektensterben: »Wir sind immer noch bei Stufe null«”, Spektrum der Wissenschaft, 19 March 2025. ↩︎
-
Nationales Monitoringzentrum zur Biodiversität, profile “Bundesweites Insektenmonitoring”, retrieved 6 October 2026. ↩︎
-
Nationales Monitoringzentrum zur Biodiversität, 9. Sitzung des Steuerungsgremiums, Ergebnisprotokoll, meeting of 18 July 2025. ↩︎
-
Nationales Monitoringzentrum zur Biodiversität, “Kofinanzierung von Monitoringprogrammen”, retrieved 6 October 2026. ↩︎
-
Bundesamt für Naturschutz, “Insektenmonitoring”, retrieved 6 October 2026. ↩︎
-
Ellen A. R. Welti and 42 others, “Temperature drives variation in flying insect biomass across a German malaise trap network”, Insect Conservation and Diversity 15(2): 168–180, 2022. ↩︎
-
Peter Haase, Dominik Buchner, Florian Leese, Carsten Morkel, Torsten Raab and James S. Sinclair, Bestimmung der Artenvielfalt von Fluginsekten in hessischen Gebieten mittels molekularer Methoden, final report, Senckenberg Forschungsinstitut for the Hessian state agency HLNUG, 2023, p. 10. ↩︎
-
Francisco Sánchez-Bayo and Kris A. G. Wyckhuys, “Worldwide decline of the entomofauna: A review of its drivers”, Biological Conservation 232: 8–27, April 2019. Conclusions, p. 22. ↩︎
-
Damian Carrington, “Plummeting insect numbers ’threaten collapse of nature’”, The Guardian, 10 February 2019. ↩︎
-
Atte Komonen, Panu Halme and Janne S. Kotiaho, “Alarmist by bad design: Strongly popularized unsubstantiated claims undermine credibility of conservation science”, Rethinking Ecology 4: 17–19, 19 March 2019. ↩︎
-
“RETRACTION: Parallel Declines in Abundance of Insects and Insectivorous Birds in Denmark Over 22 Years”, Ecology and Evolution 16(6): e73864, June 2026. ↩︎
-
“Erratum for the Report “Meta-analysis reveals declines in terrestrial but increases in freshwater insect abundances” by R. Van Klink, D. E. Bowler, K. B. Gongalsky, A. B. Swengel, A. Gentile, J. M. Chase”, Science 370(6515): eabf1915, 23 October 2020. The German figure is in the table of old and new estimates in the supplement on Zenodo. ↩︎
-
H. Holden Thorp, “Editorial Expression of Concern for the Report “Meta-analysis reveals declines in terrestrial but increases in freshwater insect abundances””, Science 391(6783): 360, 22 January 2026. ↩︎
-
Laurence Gaume and Marion Desquilbet, “InsectChange: Comment”, Peer Community Journal 4: e97, 8 October 2024. ↩︎
-
Roel van Klink, Diana E. Bowler, Konstantin B. Gongalsky, Minghua Shen, Scott R. Swengel and Jonathan M. Chase, “Disproportionate declines of formerly abundant species underlie insect loss”, Nature 628: 359–364, published online 20 December 2023. ↩︎
-
Callum J. Macgregor, Jonathan H. Williams, James R. Bell and Chris D. Thomas, “Author Correction: Moth biomass has fluctuated over 50 years in Britain but lacks a clear trend”, Nature Ecology & Evolution 5: 865–883, 14 May 2021. ↩︎